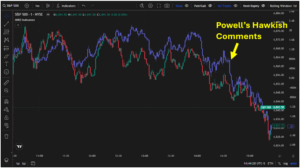
Last week, SPX tested all-time highs at 6,920 while also reaching lows near the key gamma strike of 6,815 — a journey that balanced euphoria and anxiety. Wednesday morning began with a major risk alert from our AM Founder’s Note, which was validated over the next two days: the combination of the “spot up, vol up” […]
Market Analysis
Optimizing Options Earnings Trades
🎯 Stop Guessing Earnings Volatility — Start Predicting It If you’ve ever bought calls into a massive earnings beat… and still lost money, you’re not alone.It’s one of the most frustrating moments in trading: the stock rips higher, but your options bleed out because volatility collapses. That’s not bad luck.That’s mispriced volatility — and it’s […]
Vol Deflates, GLD Sells Off, and Earnings Season Ramps Up
Special Note: You’re invited to join SpotGamma on October 28 as we kick off Hidden Forces Unmasked, our live trader event built to help you protect PnL, outsmart volatility, and spot your next winning setup before the open. Get first access to our new Options Calculator and supercharged HIRO, along with the full suite of SpotGamma tools, free. Plus, score a shot at exclusive giveaways. Vol Deflates, […]
Volatility Returns in Time for Earnings Season
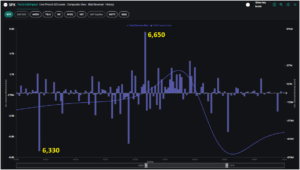
Volatility announced its return last week as the S&P 500 swung across intraday trading ranges of 150+ handles. SPX tested both the 6,550 and the 6,700 key levels we mentioned in our AM Founder’s Note on Monday before closing up 1.7% for the week at 6,674. Persistent negative gamma set the stage for heightened realized volatility, as dealers […]
From Calm to Chaos: Trading With Confidence Amidst Volatility
Friday’s massive selloff was a stark reminder of how markets can switch from calm to chaos at the drop of a hat. As volatility hit, the S&P 500 fell more than 1% in just a few minutes on October 10, closing the day down 2.7% in one of the sharpest single-day declines of the quarter. […]
What Led to Friday’s Selloff?
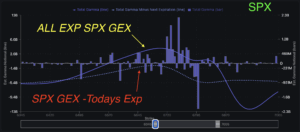
An otherwise sleepy week awoke with a jolt on Friday, following China’s announcement of restrictions on the selling of rare-earth minerals and susbequent tariff threats. Within minutes, SPX dropped 80 points from 6,750 to 6,670 – well below our risk-off level at 6,700. The market closed down 2.7% for the day at 6,553. This sharp pullback was severe, […]
Low Vol, Stubborn VIX, and a Market Full of Mixed Signals
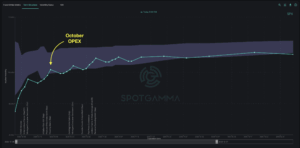
Last week, SPX tested the key gamma levels at 6,640 and 6,750 we highlighted in Monday’s Founder’s Note, marking a new all-time high with a close 6,716. The impact of the government shutdown starting on October 1 seems to have barely registered. On Tuesday, the massive JPM Collar rolled from the 6,505 strike to a new […]
Market Braces for the Specter of Volatility Into October
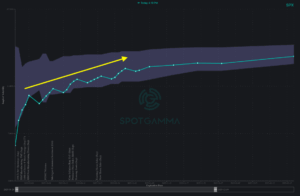
Last week, SPX tagged fresh all-time highs near the 6,700 Call Wall before surrendering gains in a series of controlled selloffs down to as low as 6,580, finally closing the week at 6,644. The “Stock Up, Vol Up” system flashed warning signs mentioned in last Wednesday’s AM Founder’s Note. This dynamic represents a fundamental breakdown in the normal […]
S&P Remains Resilient – But For How Long?
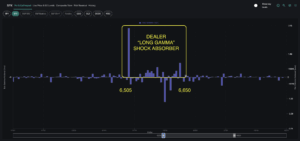
The S&P 500 closed the week at 6,661, posting a 1% weekly gain as markets navigated through the highly anticipated FOMC. What made this week particularly noteworthy was the extreme complacency at its start: one-month realized volatility sat at a meager 8%, and implied volatility hit basement-level 5% for this past Monday. These are some of the […]
Zombie Market Faces a Triple Witching OPEX
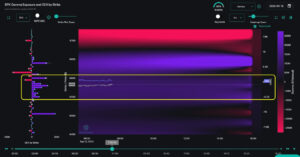
The S&P 500 delivered a grinding week, closing at 6,584 on Friday and up 1.3% from Monday’s open of 6,498. The 6,505 JPM Collar call acted as a critical pivot, where previous resistance turned into support. We shared our zombie market thesis in our Founder’s Note on Monday morning: current positive dealer gamma – driven by extremely short-dated options […]