• Skip to main content
  • Skip to primary sidebar

SpotGamma™

S&P 500 Stock Market Gamma Trading Levels Based on Options Open Interest

  • About
  • Pricing
  • Academy
  • Resources
    • Tool Demos
    • Case Studies
    • Blog
    • Support Center
    • Daily Report
    • Free Trading Tools
      • Opening Setup Free Report
      • Options Profit Calculator
      • SPX Gamma Exposure
      • Implied Earnings Moves
    • Free Training
    • Report Card
  • Login

Market Analysis

Dec 02 2019

Strike of the Deltas – Can Put Deltas Move the Market Down?

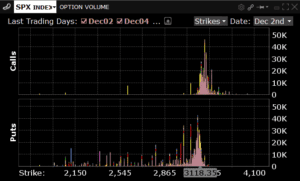
Bar charts of SPX INDEX option volume for calls and puts by strike from 2,150 to 4,100, highlighted at 3,118.

Interesting day in the market today as numerous China related headlines took away a futures rally that was testing all time highs. Its our view that much of the selling today was due to put buying. It seems there was a decent amount of slightly OTM puts trading, combined with a large move up in […]

Written by SpotGamma · Categorized: Market Analysis · Tagged: hedging, market makers, options volume, put delta, VIX

Nov 27 2019

Tracking Deltas on a Large Expiration

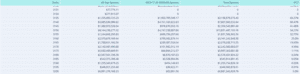
Table showing gamma values by strike from 3131 to 3200, including all expirations, Nov 29 2019, totals and percentages.

Today is an interesting setup that we’d like to document. Currently its Wednesday afternoon with Thanksgiving tomorrow. Therefore tomorrow US markets are closed and a 1/2 day Friday. We picked up on our charts a large amount of at the money (ATM)/slightly in the money ITM calls expiring on Friday at the close. You can […]

Written by SpotGamma · Categorized: Market Analysis · Tagged: delta, hedging, options expiration

Nov 26 2019

Nomura’s McElligott Explains The ‘Perfect Virtuous Feedback Loop’ As Gamma Gravity Pins Equities “Intraday movement is squelched”.

From Heisenberg a great note from Nomura which syncs with what we wrote in recent weeks and to our subscribers. “Price movements over this summer once again clearly emphasized the spot/gamma/realized vol dynamics”, SocGen wrote, in a September note documenting a crucial dynamic that can always be described as “underappreciated” until everyone understands it. “All […]

Written by SpotGamma · Categorized: Market Analysis · Tagged: market gamma, mcelligott, nomura

Nov 25 2019

Why Track Gamma, Not Delta?

This question of why we track gamma and not delta comes up fairly often. (For those needed a level one primer on delta vs gamma go here: OptionsPlaybook. If you need a primer on options market makers check here.) Our belief is that when options market makers (MM’s) start and end each day delta neutral. […]

Written by SpotGamma · Categorized: Market Analysis · Tagged: market delta, market gamma

Nov 22 2019

SpotGamma vs Nomura

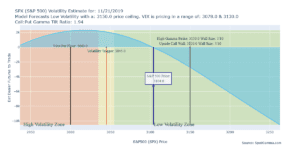
SPX volatility chart showing dealer futures vs price, high/low volatility zones, put floor at 3000 and call wall at 3150.

We like to post the banks gamma model output as way to check our own models. The two line up almost exactly. For now, US equities are “pinned” thanks to helpful greeks – at least until something really bad happens. “The fact remains that SPX will stay ‘sticky’ up here between the enormous 3100- ($9.4B […]

Written by SpotGamma · Categorized: Market Analysis · Tagged: gamma, mcgelligot, model compare, nomura

Nov 20 2019

Action on “China Phase 1 2020” Selloff
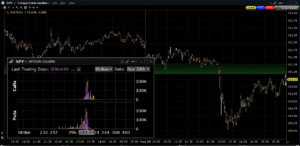
SPY 2-min candlestick chart with Nov 20 options volume showing calls and puts clustered near 310.

Here is our view of the trading day today. The market started off the day long abut $2bn in gamma and at the lows of the day it was down to ~$1.75 bn. Despite the reduction that is still a hefty amount of gamma that supports a mean reverting market. On top of that we […]

Written by SpotGamma · Categorized: Market Analysis · Tagged: gamma, phase 1, pin

Nov 20 2019

Gamma vs Realized Volatility

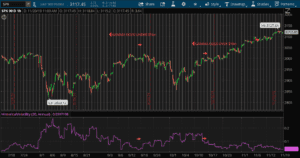
SPX hourly candlestick chart shows gamma going under and over $1bn with historical volatility below.

Gamma appears to give traders an edge in predicting market volatility. Here we show the last few months of historical volatility as a quick method to back up this point. Volatility does not imply a direction in the market, just expanded movement. Often this is correlated with market drops, but also rapid rises as seen […]

Written by SpotGamma · Categorized: Market Analysis · Tagged: gamma, historical volatility, realized volatility

Nov 19 2019

The January 2018 Market Analogy

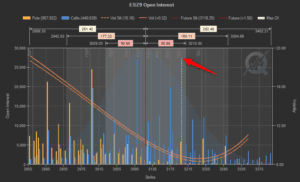
ESZ9 open interest bar chart showing yellow puts and blue calls by strike with volatility curves and red future line.

We’ve been seeing extreme call/put measures the past several weeks and these extreme measures only give way to more extreme measures. Nomura & JPM noted how heavy call positioning is relative to puts recently. There is also anecdotal evidence like this chart below, where Macrohedged notes: ” We cannot recall EVER seeing max OI for […]

Written by SpotGamma · Categorized: Market Analysis · Tagged: call roll, gamma squeeze, gamma trap, january 2018, short volatility

Nov 15 2019

Nomuras November Gamma Report

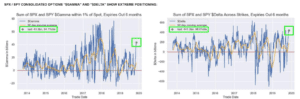
Two line charts of SPX and SPY gamma and delta from 2014 to 2020 highlighting recent extreme positioning.

From Heisneberg we get a glimpse into Nomuras gamma view, which seems to coincide with what we see. Namely gamma is about as high as we’ve ever seen, this past week hitting $2.7 billion compared to an all time high of ~$2.9bn in August of 2018. At the same time, investors have leaned into equities […]

Written by SpotGamma · Categorized: Market Analysis · Tagged: gamma, mcelligot, nomura

Nov 14 2019

The Man Who Solved the Market

An interesting quote – one of many from the book. I believe pertains greatly to market gamma and what we are trying to model. These were pulled from a great twitter thread, linked at bottom. “LTCM’s basic error was believing its models were truth,” Patterson says. “We never believed our models reflected reality — just […]

Written by SpotGamma · Categorized: Market Analysis

  • « Go to Previous Page
  • Go to page 1
  • Interim pages omitted …
  • Go to page 61
  • Go to page 62
  • Go to page 63
  • Go to page 64
  • Go to page 65
  • Interim pages omitted …
  • Go to page 69
  • Go to Next Page »

Primary Sidebar

SpotGamma-Subscriber-Signup-Banner

  • Right-Tail Risk On CNBC: The Larger Moves Have Come To The Upside
  • CYTK: A $390K Options Bet Targets November FDA Catalyst
  • Why Option Premiums Look Too Thin To Sell
  • CPI Meets Positive Gamma: The SPX Levels That Could Determine the Next Move
  • The OPEX Effect: Put Selling Is Still Doing The Work
  • youtube
  • x
  • Privacy Policy
  • Disclaimer
  • Terms & Conditions
  • Support Center
  • Media
  • Contact Us

©2026 TenTen Capital LLC DBA SpotGamma

All SpotGamma materials, information, and presentations are for educational purposes only and should not be considered specific investment advice nor recommendations. Futures, foreign currency and options trading contains substantial risk and is not for every investor. An investor could potentially lose all or more than the initial investment. Risk capital is money that can be lost without jeopardizing one's financial security or lifestyle. Only risk capital should be used for trading and only those with sufficient risk capital should consider trading. Past performance is not necessarily indicative of future results. Testimonials appearing on this website may not be representative of other clients or customers and is not a guarantee of future performance or success.

View Full Risk Disclosure