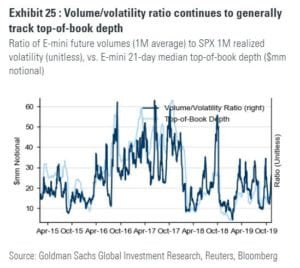
As volatility spikes S&P E-mini top of book depth decreases. Anecdotally this doesn’t come as a surprise because higher volatility should make dealers reduce size and be less aggressive. Whats interesting is that (in theory) in a negative gamma world options hedgers don’t reduce their size, so they just face less liquidity which means their […]
Market Analysis
Delta Hedging Example
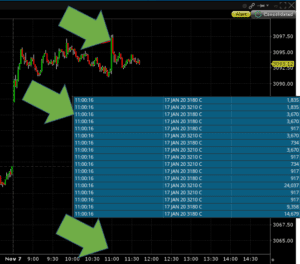
We talk a lot of gamma, but here is delta in action. Someone sweeps up a bunch of SPX calls making market maker hedge right away. While everyone is checking for china tweets it turns out was just a hedge. Not he timestamp on the trades is 11 AM (blue box, left column) as is […]
Gamma Does Exist! Pin Edition
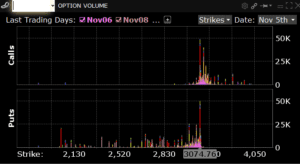
3075 dominated volume and $SPX closes 3074.77. Gamma forecast was range of ~15 handles on day. Here is an explainer on market gamma for those new to the concept.
Monitoring the Call Gamma Squeeze
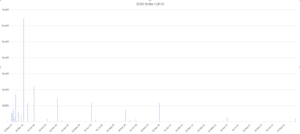
The idea has been that the roll-up of the 3050 calls to 3100 calls has caused a squeeze (see here) and that the 3100 strike currently holds the key to the next move in the SPX. November SPX expiration may help to get things moving – you can see in the chart below there is […]
Call Roll Gamma Trap
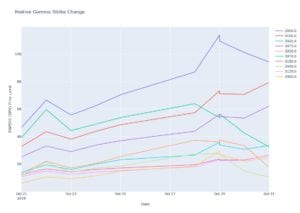
Most of the time when we talk about “gamma traps” people assume its a downside only event. I don’t think thats true. As I once read somewhere “gamma happens both ways”. There is evidence the last several days rise in stocks was caused by calls being rolled up. If market makers are on the other […]
SPY Gamma Visualization
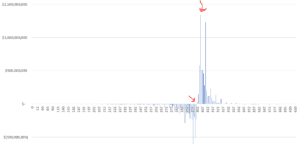
Below is a chart of gamma across all strikes in SPY. You can see that there is a large amount of gamma supply at 305 (right most arrow) and gamma flips from positive to negative around 301. It is below that strike where our model predicts increased volatility as dealers go from buyers to sellers. […]
Fed Versus High Gamma
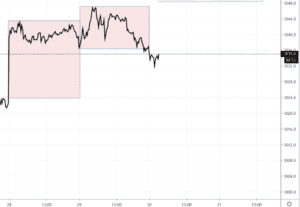
Today we have an interesting confluence of events: a FED FOMC rate day and ultra high S&P500 market gamma. As of this posting( 10/30 @ 10:30 AM EST) market gamma is ~$1.8 billion which is quite high and forecasts an S&P500 trading range of 50 bps (1/2%). The Fed is widely expected to cut rates […]
Does Gamma Create Overnight Market Out-performance?
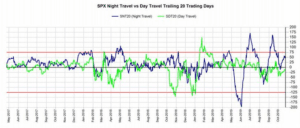
One of the working theories we’ve had is that the out performance of the S&P500 during the overnight session is due to market gamma. The idea is that options dealers gamma hedging keeps the market in check during cash sessions, and overnight the market can move about more. The chart below shows how much more […]
Why Market Gamma May Be Useful for Futures Traders
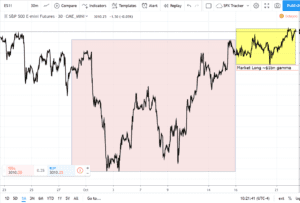
Here is a quick example to illustrate how market gamma may be useful for a futures trader. The last week SpotGamma has calculated a very large amount of gamma in the market, north of $1 billion. That predicts a tight, range-bound market. Below is a chart of the last month, the yellow box highlights a […]
Why Market Gamma Levels Matter
Here is a very low level primer as to what dealer gamma means and why those levels appear to influence the markets. There are many assumptions and oversimplifications made here. See our other articles and FAQ for more detailed information. Dealer gamma is a dollar value that estimates how much options dealer may have to […]