• Skip to main content
  • Skip to primary sidebar

SpotGamma™

S&P 500 Stock Market Gamma Trading Levels Based on Options Open Interest

  • About
  • Pricing
  • Academy
  • Resources
    • Tool Demos
    • Case Studies
    • Blog
    • Support Center
    • Daily Report
    • Free Trading Tools
      • Opening Setup Free Report
      • Options Profit Calculator
      • SPX Gamma Exposure
      • Implied Earnings Moves
    • Free Training
    • Report Card
  • Login

VIX

Feb 08 2026

The Market’s 0DTE Underbelly Is Exposed
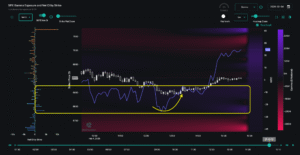
SPX options data showing strike prices, net open interest, and gamma exposure throughout trading hours on Feb 4, 2026.

Last week reminded us just how fast market stability can give way to volatility. After trading near all-time highs at 7,000, the S&P 500 fell 3% in just three sessions, closing Thursday at 6,798 amid weakness in software and crypto. Our last Sunday Newsletter focused specifically on how this type of fragility underscores today’s market. This […]

Written by Simon Scholten · Categorized: Market Analysis, SpotGamma Weekly · Tagged: FOMC, iv, OPEX, positive gamma, spotgamma weekly, SPX, VIX, volatility

Feb 01 2026

SPX Touches 7,000 and Cracks — What Makes This Market So Fragile?
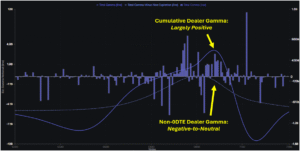
Chart showing cumulative dealer gamma (positive) and non-Odte dealer gamma (negative) across strike prices, with bars indicating gamma levels.

Market Fragility in the Face of All-Time Highs As the S&P 500 pushes record highs, the options market continues to flash warning signals beneath the surface. Underlying risk from volatility discrepancies and index-equity correlation suggest an environment prone to vol spasms — similar to what we witnessed with Thursday’s (1/29) sharp selloff and reversal. These […]

Written by Simon Scholten · Categorized: Market Analysis, SpotGamma Weekly · Tagged: FOMC, iv, OPEX, positive gamma, spotgamma weekly, SPX, VIX, volatility

Jan 25 2026

Vanna Fuels Market Rally as Market Fears Subside
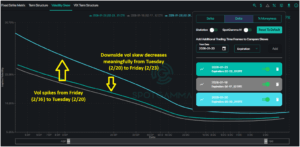
Volatility skew chart showing downside vol decreasing from Tuesday to Friday while upside vol spikes, with three comparable trading dates tracked.

Last week began with fear dominating market sentiment: analysts widely attributed Tuesday’s 2% SPX selloff to Greenland worries and tariff threats. As we pointed out in last weekend’s newsletter, traders had begun hedging against downside risk as put skew increased and volatility premiums rose. However, the quick turnaround back to SPX 6,900 seemed to erase any […]

Written by Simon Scholten · Categorized: Market Analysis, SpotGamma Weekly · Tagged: FOMC, iv, OPEX, positive gamma, spotgamma weekly, SPX, VIX, volatility

Jan 18 2026

Defensive Positioning Emerges as Market Rallies

VIX options chart showing total gamma and convexity across strike prices with negative gamma trend.

Traders Turn Defensive In the Face of Market’s Climb SPX tested fresh all-time highs last week, with positive gamma providing guardrails for the broader market. In the face of headline noise—from criminal investigations into Powell to Iran-related escalation—the market absorbed every dip, with the 6,890 Risk Pivot level from Monday’s AM Founder’s Note holding firm. However, increasing put skew and […]

Written by Simon Scholten · Categorized: Market Analysis, SpotGamma Weekly · Tagged: FOMC, iv, OPEX, positive gamma, spotgamma weekly, SPX, VIX, volatility

May 12 2025

SpotGamma on Stock Market TV

Three commentators in a Stock Market TV morning show split-screen video with overlay text about volume.

SpotGamma joined Stock Market TV to discuss how options drive stocks, including what signals are provided by Call Walls & Put Walls. We also dove into why the VIX can often be a misleading volatility signal. Find High-Reward Setups — FastStart Profiting

Written by SpotGamma · Categorized: Market Analysis · Tagged: options levels, Stock Market TV, VIX

Mar 08 2024

Why is the VIX So Low? Structured Products Offer an Answer

Three-panel BIS chart of VIX and ETF flows, ODTE leverage versus returns, and 1MTE versus ODTE bars through 2023.

Equity market volatility (VIX) has been surprisingly low in 2023 despite uncertainty about interest rates and geopolitics. Some attribute this to the rise of short-term “zero-days-to-expiry” (0DTE) options trading. However, a recent article by the BIS argues that 0DTE trading is unlikely to be the main cause for low VIX and provides an alternative explanation: […]

Written by SpotGamma · Categorized: Market Analysis · Tagged: "0DTE options", "structured products", "yield enhancement, VIX, volatility

Mar 11 2023

The Silicon Valley Bank Collapse and How the Options Market Reacted

options-risk-silicon-valley-bank

The VIX Jumps, Shocking Record Put Volumes and Real Tail Risk With the SVB risks, we see a shift higher in options tail risk pricing, but not a surge in open interest at a macro level. KRE, the Regional Bank ETF, saw record put volume, and there is record VIX call open interest. XLF and […]

Written by SpotGamma · Categorized: Market Analysis · Tagged: Silicon Valley Bank, SVB, VIX

Dec 23 2021

‘Call AAA’: Santa Claus Is Having Sleigh Troubles
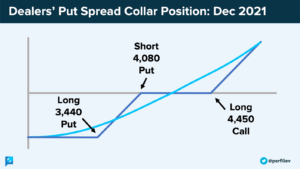
Dealer Put Spread Protective Collar Dec 2021

Through an options market lens, the following text will add color to some recent market movements.

Written by Renato Capelj · Categorized: Market Analysis · Tagged: AMC, ARKK, Call Wall, Cem Karsan, charm, CME, december OPEX, delta, FOMC, gamma, Kai Volatility, liquidity, long gamma, Moody's, Newfound Research, OPEX, put wall, short gamma, SPY, TSLA, vanna, VIX

Nov 29 2021

If These Bond ETF Levels Break, You Better Buckle Up
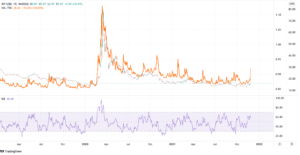
TradingView daily IEF/LQD ratio chart with orange VIX overlay and RSI, plus a March 2020 spike.

The following is a guest post courtesy of Michael Kramer of Mott Capital Management.  There is instability in the bond market right now. In the face of a potential break, there may be a wave of volatility as market participants begin to price in changes to Fed monetary policy.  Cracks are already showing as bond […]

Written by SpotGamma · Categorized: Guest Post, Market Analysis · Tagged: Equity Hub, ETF, Michael Kramer, VIX, volatility

Oct 08 2021

Earnings Uncertainty Could Cause a Market Meltdown

Rising Uncertainty Leads to Market Crash?

The following is a guest post courtesy of Michael Kramer of Mott Capital Management.  As uncertainty ticks higher in markets, volatility tends to follow. There is a tremendous amount of doubt building in the equity markets, especially regarding corporate earnings. With the market on the cusp of earnings season, volatility may see a massive spike.  […]

Written by developer · Categorized: Guest Post, Market Analysis · Tagged: market crash, Michael Kramer, VIX, volatility

  • « Go to Previous Page
  • Go to page 1
  • Go to page 2
  • Go to page 3
  • Go to page 4
  • Go to Next Page »

Primary Sidebar

SpotGamma-Subscriber-Signup-Banner

  • The S&P500’s Diversification Problem
  • Quiet Oil Options Mask Tail Risk
  • Celsius Insiders Are Buying the Dip — And Options Are Cheap Into the Catalyst
  • Trump Xi Summit and the Market Outlook
  • AI Stocks Options Positioning: Call Selling, Not Put Buying
  • youtube
  • x
  • Privacy Policy
  • Disclaimer
  • Terms & Conditions
  • Support Center
  • Media
  • Contact Us

©2026 TenTen Capital LLC DBA SpotGamma

All SpotGamma materials, information, and presentations are for educational purposes only and should not be considered specific investment advice nor recommendations. Futures, foreign currency and options trading contains substantial risk and is not for every investor. An investor could potentially lose all or more than the initial investment. Risk capital is money that can be lost without jeopardizing one's financial security or lifestyle. Only risk capital should be used for trading and only those with sufficient risk capital should consider trading. Past performance is not necessarily indicative of future results. Testimonials appearing on this website may not be representative of other clients or customers and is not a guarantee of future performance or success.

View Full Risk Disclosure