• Skip to main content
  • Skip to primary sidebar

SpotGamma™

S&P 500 Stock Market Gamma Trading Levels Based on Options Open Interest

  • About
  • Pricing
  • Academy
  • Resources
    • Tool Demos
    • Case Studies
    • Blog
    • Support Center
    • Daily Report
    • Free Trading Tools
      • Opening Setup Free Report
      • Options Profit Calculator
      • SPX Gamma Exposure
      • Implied Earnings Moves
    • Report Card
  • Login

VIX

May 10 2020

Morgan Stanley VIX & SPX Market Gamma Update

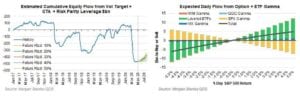
Line chart of cumulative vol-target equity flows 2017-2020 next to bars of expected option and ETF gamma vs S&P 500 return.

From Zerohedge we see some nice Gamma related research from Morgan Stanley. Posted below is their note. By Chris Metli of Morgan Stanley Quantitative Derivative Solutions The March 2020 equity selloff ushered a huge volatility shock that caused unprecedented losses for short volatility strategies.  The impact is likely bigger than just a one-time hit to […]

Written by tenten · Categorized: Market Analysis · Tagged: correlation, long gamma, morgan stanley, short gamma, VIX

Dec 02 2019

Strike of the Deltas – Can Put Deltas Move the Market Down?
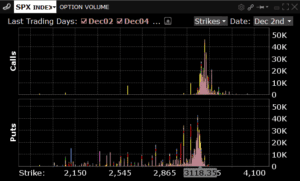
Bar charts of SPX INDEX option volume for calls and puts by strike from 2,150 to 4,100, highlighted at 3,118.

Interesting day in the market today as numerous China related headlines took away a futures rally that was testing all time highs. Its our view that much of the selling today was due to put buying. It seems there was a decent amount of slightly OTM puts trading, combined with a large move up in […]

Written by SpotGamma · Categorized: Market Analysis · Tagged: hedging, market makers, options volume, put delta, VIX

Oct 21 2019

Has Gamma Made the VIX “Useless”

Posting this as something to revisit later. Zerohedge posted the following recently: If one observes a conventional indicator of prevailing risk sentiment such as the VIX, which is trading in the low teens and near the lowest levels over the past two years (and far below its long-term average of 20), one would be left […]

Written by SpotGamma · Categorized: Market Analysis · Tagged: VIX

Aug 21 2019

Gamma Driven VIX Drop

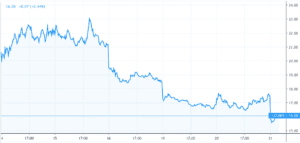
Line chart of declining values from 23 to 16.08, labeled 16.08 +0.07 (+0.44%) and -22.06%.

There was quite a large move down in the VIX overnight (8/20/19) and Nomura claims that was due in part to the gamma around a large VIX position. This gamma driven VIX drop is apparently related to hedging around a large VIX position. When options decay this can effect the amount of hedging that a […]

Written by SpotGamma · Categorized: Market Analysis · Tagged: 50 cent, futures, gamma, SPX, VIX

Aug 19 2019

JPM Liquidity Rates & VIX Correlation

JPM says that liquidity disappears as VIX spikes. This seems to make intuitive sense. The fact that the VIX is higher means the market is pricing in larger moves which means dealers don’t want to get stuffed with large trades as the market rips through them. This chart doesn’t tell us what level this depth […]

Written by SpotGamma · Categorized: Market Analysis · Tagged: futures liquidity, gamma, JPM, VIX

  • « Go to Previous Page
  • Go to page 1
  • Go to page 2
  • Go to page 3
  • Go to page 4

Primary Sidebar

SpotGamma-Subscriber-Signup-Banner

  • Tech Vol Collapsed, Put Skew Held Rich: Options Action Live on CNBC
  • Gamma Guy: The 0DTE Flow That Usually Pins the Index Didn’t Arrive
  • AMD Earnings Preview: Can AI Growth Overcome Rising Volatility and Expectations?
  • Relatively Few Traders Are Positioned For The Right Tail
  • Palantir (PLTR) Earnings Preview: Can AI Growth Justify Another Explosive Move?
  • youtube
  • x
  • Privacy Policy
  • Disclaimer
  • Terms & Conditions
  • Support Center
  • Media
  • Contact Us

©2026 TenTen Capital LLC DBA SpotGamma

All SpotGamma materials, information, and presentations are for educational purposes only and should not be considered specific investment advice nor recommendations. Futures, foreign currency and options trading contains substantial risk and is not for every investor. An investor could potentially lose all or more than the initial investment. Risk capital is money that can be lost without jeopardizing one's financial security or lifestyle. Only risk capital should be used for trading and only those with sufficient risk capital should consider trading. Past performance is not necessarily indicative of future results. Testimonials appearing on this website may not be representative of other clients or customers and is not a guarantee of future performance or success.

View Full Risk Disclosure