From ZeroHedge While JPMorgan could not agree last week if the month-end pension and fund flows (which according to one JPM quant at $200bn would be the largest forced selling since March, and according to another would be a “tailwind” for equities) would be positive or negative for stocks, one look at market gamma suggests that contrary […]
Market Analysis
SQ Profile
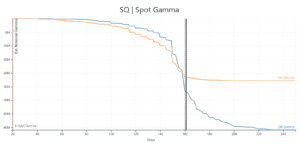
SQ has been off to a strong start lately, with our model picking up 160 as a major area in the stock. You can see that above there gamma is positioned to support a shift into the 180 area. Below 160 we think the stock has more limited downside do to the concentration of calls/puts.
ES Futures 9/22/20
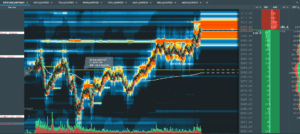
ES futures bounce off of our 3267 low and close right on the ZeroGamma level. Our levels are noted at left in the “Gamma” column. This is the Bookmap trading system.
ORCL Launch?
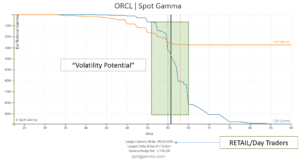
One of the names catching headlines recently is ORCL. They have a conditionally approved deal to takeover TikToc, and that appears to have call buyers excited. In the chart below our “Hedge Wall” (blue dotted line) is at 60 – this is a key support/resistance level in the name. Note the blue call gamma line […]
How a retail options craze fueled SoftBank’s ‘whale’ trade
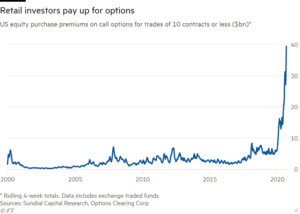
FT article shines light on what we said: Softbanks wasnt so much of a whale. …retail traders have together spent almost $40bn on similar trades just over the past four weeks, according to Sundial Capital Research. Dean Curnutt, the chief executive of Macro Risk Advisors, a derivatives strategy firm, said those millions of retail traders […]
Nomura September Update: It’s Not Over Yet
Nomura Warns “Vol-Control” Funds Continue To Drive Incremental “Sell Flows” Simply put, Nomura’s MD of Cross-Asset Strategy, Charlie McElligott, warns, it’s not over yet… Yesterday was a reminder on the magnitude of the $Gamma clean-up that is being worked out of by the US Eq Vol Dealer community as per the 50-handle S&P mush-down in the final […]
No, Softbank Didn’t Weaponize Options Gamma
One of the biggest stories at the moment is that of Softbank and their massive options positions which many are attributing to the markets large runup in late August. There are a ton of stories and opinions floating around on this topic and we thought it warranted a bit of mapping to clear some truths […]
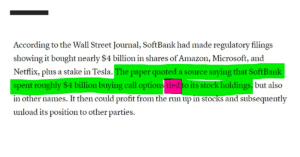
SoftBank unmasked as ‘Nasdaq whale’ that stoked tech rally
From the FT Please use the sharing tools found via the share button at the top or side of articles. Copying articles to share with others is a breach of FT.comT&Cs and Copyright Policy. Email licensing@ft.com to buy additional rights. Subscribers may share up to 10 or 20 articles per month using the gift article […]
AAPL Options Gamma Unwind
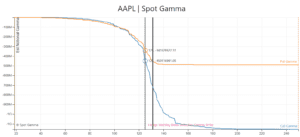
It’s September 3, 2020 and parts of the market crashed. Let’s start with AAPL.
Nomura Gamma Crash Up

From ZH On Saturday, when we published our lengthy compendium of bizarro market charts showing the paradoxical melt up in both risk assets and the VIX, leading to the most positive correlation between the S&P and the VIX since the Feb 2018 Volmageddon event… … we said that “one reason why no conventional indicator seem to matter […]
