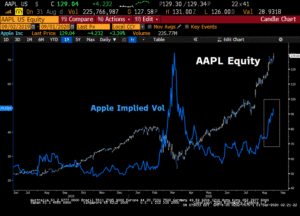
From ZH And since nothing else has changed and we already showed what is going on from a delta- and gamma-hedging perspective… … we will give the last word to the Bear-Traps report which describes the “Insanity” in Apple Options: The convexity skew picture on big-name equities like Apple $AAPL has gone parabolically stupid. Let’s keep this […]
Market Analysis
WMT Options Gamma Trap
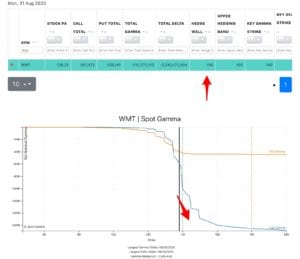
WMT is trading over 5% higher today be in on rumors of new services, or possibly buying TikToc. Doesnt matter. Whats interesting is there are a LOT of call options sitting >=140 strike, with another 240k calls trading so far today. Its 11AM EST. It appears the gamma could fuel a move up toward $160, […]
FANGMAN+T Call vs Put Interest
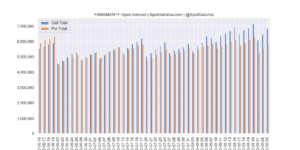
In June we saw put interest leading in the top tech names, but over the past two months we’ve see call open interest gap well over put open interest.
FB Making a Gamma Move?
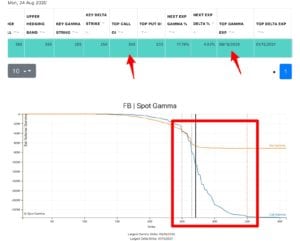
FB has an interesting setup here as call gamma is consolidating around 265 and call open interest is building up around the 300 strike. If this call building trend continues it may cause increased volatility in the name. Volatility infers movement, which could be a rapid move higher OR lower. In this case we give […]
Nomura August “Extreme Gamma”
From ZH As the Nasdaq goes from new record to new record high day after day, passively lifting AAPL to become the world’s first $2 trillion market capitalization company, something uncomfortable is happening under the hood. While the concentration of gainers in the Nasdaq has been well-discussed… There is an increasingly ominous major (bearish) divergence […]
Futures, Options and Liquidity.
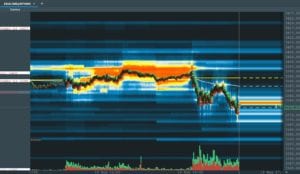
We’ve been marking 3400 as a large gamma area for several days, and you can see from our morning data that the 3400 area was again key today. Our levels are listed above, left in the Bookmap column. You can also see dark red areas in the center of the chart which denotes bid/ask liquidity, […]
XOM Balanced Options Position
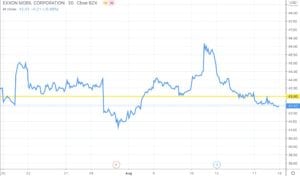
A member requested analysis of XOM which you can see below. It appears the gamma has sort of a “straight jacket” on XOM with large put interest at 40, large call interest at 50. Our Hedge Wall picks up a change in hedging behavior at 43, which indicates that’s a key level in the stock. […]
Silver August Expiration
Below is our most recent data for SLV (silver ETF) going into Fridays August options expiration. Call option positions remain at or near the highs we’ve seen over the last several weeks. There is a large concentration of options at the 25 and 30 strikes which presents an interesting setup. If SLV can charge ahead […]
S&P 500 Double Top

Its interesting too look back at where we were in February ’20 just days before the crash. Clearly things are different now, and we are suggesting a >30% drawdown (for one, the put fuel isn’t there). However its interesting to compare sentiment and data particularly as we have hit a double top just before a […]
PRPL Mattress Fire – Options IV Burn
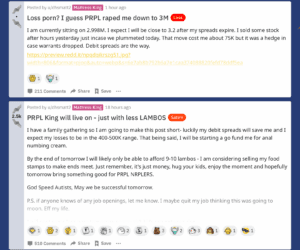
PRPL is a major retail WallStreetBets favorite, causing a huge runup in to 8/13 earnings. After reporting an ER beat the IV in the stock likely got crushed, which caused long OTM calls to decline sharply. This leads to dealers unwinding hedges, and a stock drop.
