WKHS seemed pinned to $15 where we mark a large amount of options gamma.
Market Analysis
ROKU Analysis 8/14/20
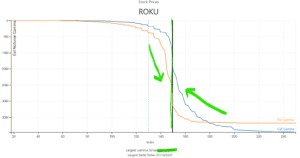
ROKU has an interesting setup day, as we show ~43% of options gamma is expiring today. Most of the options in ROKU are also at the 150 strike, which may setup an interesting “pin” play. The idea here is thats the options decay hedging flows (which are tied to 150) push the stock back towards […]
SLV Update 8/14/20
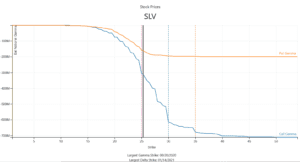
We’ve been tracking SLV & Silver closely for several weeks now. Originally there were many Jan ’21 calls struck at 20, but those have largely been either closed or rolled, such that 25 is now the key strike. Much of the gamma in SLV expires next Friday 8/21 which could add a short term dynamic […]
CSCO Earnings Crash – a Prediction
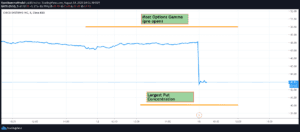
We’re positing up a live example of using our Equity Hub data. CSCO disappointed in earnings today, and is currently down 10%. Here is a snapshot of our data from preopen which shows the largest concentration of options at the 50 strike. The most puts are at 40, which we think might function as a […]
FSLY Stock Analysis
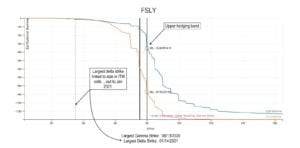
This was a great chart posted by our friend @ccurvetrading of FSLY stock based on our options data. You’ll note there was a lot of gamma put gamma set to expire today (8/13) which would be crushed if the stock started a move higher. This may have caused dealers to rapidly cover short hedges. We […]
Gamma Level Resistance – A Visualization
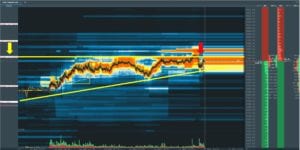
Today provided an excellent example of key resistance at an important options level in the SPX/ES. As you can see the market had a consistent bid from the open right into our 3387 SPX level (yellow arrow, left). The market spend much of the afternoon up against that resistance area, and finally rejected it towards […]
Silver SLV Gamma Volatility
Silver and the SLV ETF are having some amazing volatility as of late, with a -10% move currently underway. We’ve been watching this setup for several weeks, anticipating volatility due to the large amount of call gamma building up. We believe its important to be aware of this position as these very large moves may […]
JPM Gamma Update August ’20
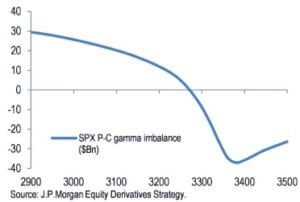
Here is a note we from JPM Equity Derivatives Strategy about SPX Gamma for August: Thought I would pass along: Our Gamma Imbalance Monitor shows the largest gamma imbalance to calls we have seen since early Feb20. This points to sizable dealer long gamma positioning. As this imbalance has grown, realized vol has ticked lower […]
Largest VIX Spikes + VIX Seasonality
Nomura August 2020 Gamma Update
Charlie McElligott’s prediction from last week that the Nasdaq could suffer from a nasty spill as dealer gamma had turned increasingly negative… … was foiled by the blockbuster earnings from the mega tech companies which sent the Nasdaq to new all time highs, forcing dealers – and frankly everybody else – to chase the year’s best performing […]
