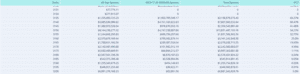
Today is an interesting setup that we’d like to document. Currently its Wednesday afternoon with Thanksgiving tomorrow. Therefore tomorrow US markets are closed and a 1/2 day Friday. We picked up on our charts a large amount of at the money (ATM)/slightly in the money ITM calls expiring on Friday at the close. You can […]
Market Analysis
Nomura’s McElligott Explains The ‘Perfect Virtuous Feedback Loop’ As Gamma Gravity Pins Equities “Intraday movement is squelched”.
From Heisenberg a great note from Nomura which syncs with what we wrote in recent weeks and to our subscribers. “Price movements over this summer once again clearly emphasized the spot/gamma/realized vol dynamics”, SocGen wrote, in a September note documenting a crucial dynamic that can always be described as “underappreciated” until everyone understands it. “All […]
Why Track Gamma, Not Delta?
This question of why we track gamma and not delta comes up fairly often. (For those needed a level one primer on delta vs gamma go here: OptionsPlaybook. If you need a primer on options market makers check here.) Our belief is that when options market makers (MM’s) start and end each day delta neutral. […]
SpotGamma vs Nomura
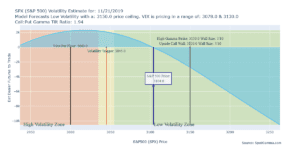
We like to post the banks gamma model output as way to check our own models. The two line up almost exactly. For now, US equities are “pinned” thanks to helpful greeks – at least until something really bad happens. “The fact remains that SPX will stay ‘sticky’ up here between the enormous 3100- ($9.4B […]
Action on “China Phase 1 2020” Selloff
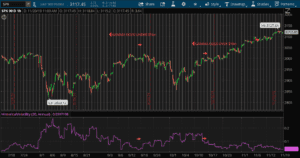
Here is our view of the trading day today. The market started off the day long abut $2bn in gamma and at the lows of the day it was down to ~$1.75 bn. Despite the reduction that is still a hefty amount of gamma that supports a mean reverting market. On top of that we […]
Gamma vs Realized Volatility
Gamma appears to give traders an edge in predicting market volatility. Here we show the last few months of historical volatility as a quick method to back up this point. Volatility does not imply a direction in the market, just expanded movement. Often this is correlated with market drops, but also rapid rises as seen […]
The January 2018 Market Analogy
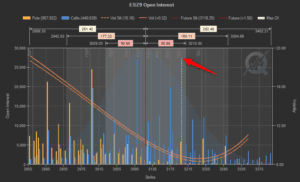
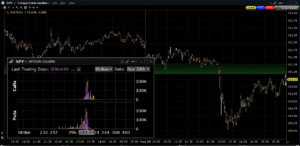
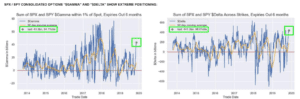
We’ve been seeing extreme call/put measures the past several weeks and these extreme measures only give way to more extreme measures. Nomura & JPM noted how heavy call positioning is relative to puts recently. There is also anecdotal evidence like this chart below, where Macrohedged notes: ” We cannot recall EVER seeing max OI for […]
Nomuras November Gamma Report
From Heisneberg we get a glimpse into Nomuras gamma view, which seems to coincide with what we see. Namely gamma is about as high as we’ve ever seen, this past week hitting $2.7 billion compared to an all time high of ~$2.9bn in August of 2018. At the same time, investors have leaned into equities […]
The Man Who Solved the Market
An interesting quote – one of many from the book. I believe pertains greatly to market gamma and what we are trying to model. These were pulled from a great twitter thread, linked at bottom. “LTCM’s basic error was believing its models were truth,” Patterson says. “We never believed our models reflected reality — just […]
Volume vs Dealer Gamma
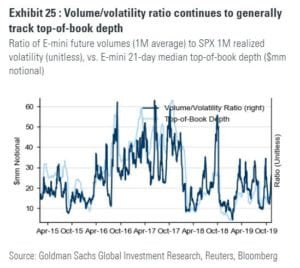
As volatility spikes S&P E-mini top of book depth decreases. Anecdotally this doesn’t come as a surprise because higher volatility should make dealers reduce size and be less aggressive. Whats interesting is that (in theory) in a negative gamma world options hedgers don’t reduce their size, so they just face less liquidity which means their […]
