Much talk focuses on options market gamma and changes in gamma around expiration. But what may be the real catalyst around OPEX is a change in deltas, not gammas. When options expiration occurs (especially a large one like December) options are closed, expire or rolled. You therefore can have large positions change, which can cause […]
Market Analysis
Nomuras Gamma Model 12/23/19
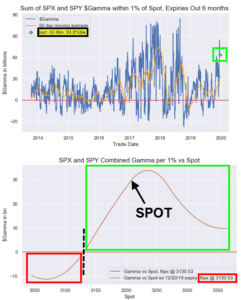
We like to post Nomuras model snapshot here to compare against ours. Our volatility neutral indicator is lower, but the top matches. Some of this may be explained by Nomura combining SPY and SPX.
Options Market Gamma Theory is All About Volume
Options market gamma numbers proliferate the market but its important to understand what exactly those numbers mean. Yes, positive gamma may indicate lower stock volatility. And when gamma flips from positive to negative that may indicate higher volatility. But the actual gamma number itself is an estimate of how much stock dealers will have to […]
BusinessInsider.com Talks Gamma
A good primer on market gamma from BI: So why do markets move at all if gamma is, like in this example, the big decelerator? Because it depends who owns it. Market makers use their gamma because they must. There is nothing worse than sitting on a position and bleeding white over time as your […]
Options Model Shows Shift Starting
December is always a large options expiration as we have large open interest and a SPY dividend payment. Because of all of this the expiration has the potential to mark turning points in the market as large positions are closed, roll or expire. 3200 has been a key level the last week with major options […]
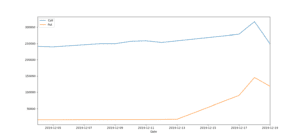
Why Dec ’19’s Large Open Interest Could Cause Volatility
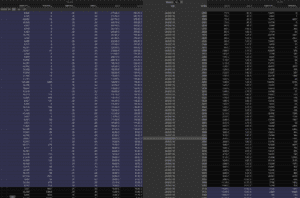
December OPEX has a many strikes that have large open interest (OI). For calls there are many in the money strikes as you can see in the grid below with OI greater than 20k or 40k – the 3000k strike has 125k contracts. There is large size in puts as well, but these are currently […]
SPX Skew Nears All Time Highs
As per Bloomberg, Skew (which measures the price of calls vs puts) can often spike when investors are concerned about market risk. Puts will be in higher demand than calls and this moves the skew measurement higher. Currently skew is very high due to a slew of events in the next week: FOMC, BREXIT vote, […]
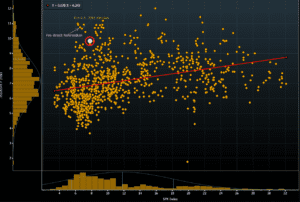
Nomuras Pre-Event Gamma View
From heisenberg: Charlie McElligott, Nomura: “As VVIX & Skew went ‘bid’ BIG TIME yday, this indicates that the market is now once again beginning to price-in ‘tail’ scenarios”, “[That] offers attractive risk-reversal opportunities to play for an upside S&P breakout following a potential ‘hedge puke’”, he added, noting that in the event we do get […]
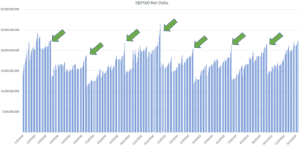
SPX Long Gamma Backtest
Recently an interesting chart was posted on twitter with the backtest of the SPX vs a strategy of owning the SPX only when gamma was positive. This brings up a few interesting points about long gamma and what we think its viable for. Below this chart are some comments and notes regarding the value of […]
December 2019 Market Decline Review
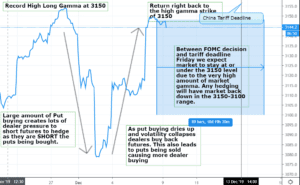
Here is a chart outlining how we saw the selloff during the first week of December 2019. There was record high gamma going into the first week of December which indicates that call:put ratios were at extremes. After a few negative tweets about trade and a poor ISM number selling started, and put buyers stepped […]
