• Skip to main content
  • Skip to primary sidebar

SpotGamma™

S&P 500 Stock Market Gamma Trading Levels Based on Options Open Interest

  • About
  • Pricing
  • Academy
  • Resources
    • Tool Demos
    • Case Studies
    • Blog
    • Support Center
    • Daily Report
    • Free Trading Tools
      • Opening Setup Free Report
      • Options Profit Calculator
      • SPX Gamma Exposure
      • Implied Earnings Moves
    • Free Training
    • Report Card
  • Login

SPX

May 13 2025

The Anatomy of an SPX 0DTE Driven Market
TRACE 0DTE Options

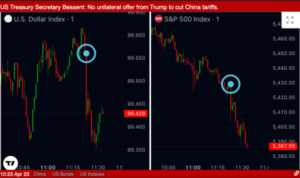
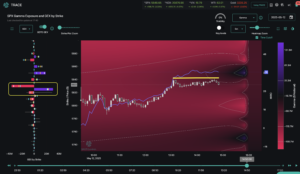
U.S. equities surged on May 12, 2025, as the S&P 500 closed +3% to 5,848, with intraday action reflecting a more modest 0.23% gain, after the U.S. and China agreed to a significant 90-day reduction in reciprocal tariffs. What did any of this have to do with 0DTE SPX options? Hint: The 0.23% intraday gain. The Anatomy […]

Written by SpotGamma · Categorized: Market Analysis · Tagged: 0DTE, cboe, SPX

Jan 20 2022

Next Week’s Fed Meeting May Create Massive Moves In The Market
spx high implied volatility jan 2022

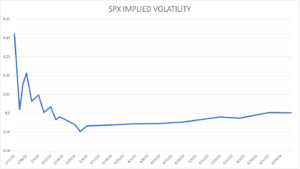
The following is a guest post courtesy of Michael Kramer of Mott Capital Management.  Stock market volatility has picked up, and it may only be starting. Investors are eagerly awaiting the next FOMC meeting on January 26 to try and gauge which way the Fed may choose to go in its fight with inflation. With […]

Written by SpotGamma · Categorized: Guest Post, Market Analysis · Tagged: Equity Hub, FOMC, implied volatility, Michael Kramer, SPX

Jan 04 2022

Trade Analysis: ES Futures (29 December 2021)
ES Futures Short Setup Doug Pless SpotGamma Dec 2021

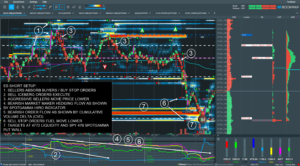
The following is a guest post from Doug Pless. When I plan to trade futures, I begin my morning preparation by reading the SpotGamma AM Founder’s Note. For ES futures, I note gamma levels, the SpotGamma Imp. 1 Day Move, the SpotGamma Gamma Index, and Gamma Notional for SPX and SPY.  I also look up […]

Written by SpotGamma · Categorized: Guest Post, Market Analysis · Tagged: Doug Pless, Equity Hub, ES futures, HIRO Indicator, Options Vanna, short, SPX

Aug 24 2021

Trading ES Futures Using SpotGamma Levels and Vanna Model
ES Futures Long Setup

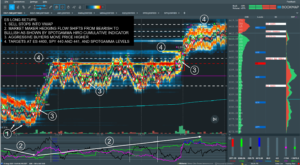
The following is a guest post from Doug Pless. As I discussed previously, I begin my morning preparation by reading the SpotGamma AM Report when I plan to trade futures. For ES futures, I note gamma levels, the SpotGamma Index, and Gamma Notional for SPX and SPY.  The SpotGamma Gamma Index is a proprietary measurement […]

Written by developer · Categorized: Guest Post, Market Analysis · Tagged: Doug Pless, ES futures, SPX, SPY, vanna

Dec 11 2019

SPX Skew Nears All Time Highs

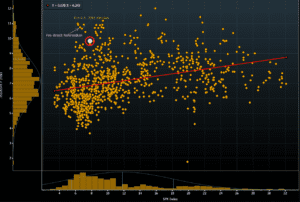
Scatterplot of SPX Index vs :95105SPX F Index with red trendline, histograms, and pre-Brexit and 2016 election labels.

As per Bloomberg, Skew (which measures the price of calls vs puts) can often spike when investors are concerned about market risk. Puts will be in higher demand than calls and this moves the skew measurement higher. Currently skew is very high due to a slew of events in the next week: FOMC, BREXIT vote, […]

Written by SpotGamma · Categorized: Market Analysis · Tagged: delta, gamma, gamma trap, skew, SPX, SPY

Aug 25 2019

Notes From 8/24/2015 Crash

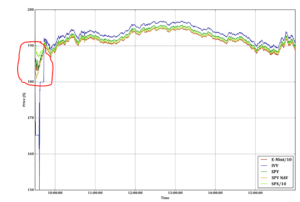
Line chart of E-Mini/10, IVV, SPY, SPY NAV and SPX/10 prices with a red-circled drop near 10:00.

Monday August 24th 2015 was a memorable day and it seemed like a good idea for a quick review given how much the current market seems to be trading. This is not a prediction for a market crash. There were a litany of reasons credited with causing the crash ( go here to see). Markets […]

Written by SpotGamma · Categorized: Market Analysis · Tagged: 8/24/2015, flash crash, market crash, SPX, SPY

Aug 23 2019

FED, TRUMP, Gamma Trap: Crazy Trading Day 8/23/19

SPX volatility chart of estimated dealer futures versus price, marking 2923 spot, 2900 put floor and 3000 wall.

Fed gave a speech that was “volatility dampening” at 10AM. Trump didn’t like what the Fed had to say so he started tweet-trashing the Fed and China triggering a “gamma trap“. Stock markets were just at the volatility trigger level of 2920 (black horizontal line) so the gap down flipped the trigger and dealers were […]

Written by SpotGamma · Categorized: Market Analysis · Tagged: dealer positioning, gamma trap, long gamma, open interest, options, S&P500, short gamma, SPX, SPY

Aug 21 2019

Gamma Driven VIX Drop

Line chart of declining values from 23 to 16.08, labeled 16.08 +0.07 (+0.44%) and -22.06%.

There was quite a large move down in the VIX overnight (8/20/19) and Nomura claims that was due in part to the gamma around a large VIX position. This gamma driven VIX drop is apparently related to hedging around a large VIX position. When options decay this can effect the amount of hedging that a […]

Written by SpotGamma · Categorized: Market Analysis · Tagged: 50 cent, futures, gamma, SPX, VIX

Aug 19 2019

Gamma Market From 8/16/19

Bar chart of SPX net gamma by strike on 08/19/2019 labeled gamma neutral 2889, vol flip 2920, high gamma strike 3000.

Volatility will continue to reign until (if) the market recaptures 2920. There is a ton of fuel ready to burn and one headline (or tweet) will send the market flying. The only recommendation that is safe here is to not sell any options, being short volatility is very dangerous here, as a >3% rally is […]

Written by tenten · Categorized: Market Analysis · Tagged: futures, market gamma, market makers, open interest, options gamma, S&P500, SPX, SPY

Aug 16 2019

Dealers Running Out of Gas 8/16/19

Scatter plot of estimated futures vs S&P 500 price from 2600-3200, peaking near 0 around 2900 with current und PX marked.

After a sharp rally this morning the S&P500 stands at ~2890. This is where dealers buying starts to soften up. You can see their volume profile in the chart below. They were strong buyers up to this level but we calculated 2891 as the level where their buying wanes and 2920 where they flip to […]

Written by tenten · Categorized: Market Analysis · Tagged: futures, gamma, market makers, options, SPX, SPY

  • « Go to Previous Page
  • Go to page 1
  • Go to page 2
  • Go to page 3
  • Go to page 4
  • Go to page 5
  • Go to Next Page »

Primary Sidebar

SpotGamma-Subscriber-Signup-Banner

  • NDX Call Skew Has Room While S&P Vol Contracts: Kochuba on tastylive
  • Costco Earnings: What Shoppers—and Options—Are Telling Us
  • The S&P500’s Diversification Problem
  • Quiet Oil Options Mask Tail Risk
  • Celsius Insiders Are Buying the Dip — And Options Are Cheap Into the Catalyst
  • youtube
  • x
  • Privacy Policy
  • Disclaimer
  • Terms & Conditions
  • Support Center
  • Media
  • Contact Us

©2026 TenTen Capital LLC DBA SpotGamma

All SpotGamma materials, information, and presentations are for educational purposes only and should not be considered specific investment advice nor recommendations. Futures, foreign currency and options trading contains substantial risk and is not for every investor. An investor could potentially lose all or more than the initial investment. Risk capital is money that can be lost without jeopardizing one's financial security or lifestyle. Only risk capital should be used for trading and only those with sufficient risk capital should consider trading. Past performance is not necessarily indicative of future results. Testimonials appearing on this website may not be representative of other clients or customers and is not a guarantee of future performance or success.

View Full Risk Disclosure