• Skip to main content
  • Skip to primary sidebar

SpotGamma™

S&P 500 Stock Market Gamma Trading Levels Based on Options Open Interest

  • About
  • Pricing
  • Academy
  • Resources
    • Tool Demos
    • Case Studies
    • Blog
    • Support Center
    • Daily Report
    • Free Trading Tools
      • Opening Setup Free Report
      • Options Profit Calculator
      • SPX Gamma Exposure
      • Implied Earnings Moves
    • Free Training
    • Report Card
  • Login

SPX

Sep 10 2026

CPI Is the Catalyst. 7600 Is the Trade.

CPI Preview: The Print That Decides Next Week's Fed Meeting

Markets are pricing a roughly 70% chance of a rate hike at the September 16 FOMC, and August CPI is the last inflation print the Fed sees before deciding. A look at what the option market is implying, the gamma setup into Friday’s expiration, and the three scenarios that matter.

Written by SpotGamma · Categorized: Market Analysis · Tagged: CPI, dealer gamma, FOMC, gamma, interest rates, negative gamma, SPX, VIX, volatility

Sep 09 2026

Gamma Guy with tastylive: Options Positioning Pins the Index While Tech Names Make Moves

Gamma Guy: September OPEX Positioning Pins the Index While Tech Moves

Brent Kochuba, founder of SpotGamma, broke down September OPEX positioning, 0DTE flows and cheap IWM hedges on tastylive Tuesday, September 8.

Written by SpotGamma · Categorized: Market Analysis · Tagged: 0DTE, AAPL, dealer gamma, dispersion, implied volatility, IWM, OPEX, SPX, tastylive

Aug 27 2026

Jackson Hole 2026: What the Options Market Expects
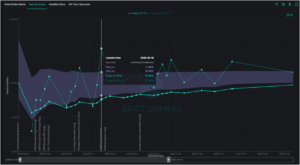
SPX term structure chart showing implied volatility from August to October 2026, with Fed Press Conference event marked on September 16.

SPY forward IV prices Jackson Hole as a non-event, but CTAs are stretched short Treasuries and SPX gamma flips near 7780 — an asymmetric setup into Friday.

Written by SpotGamma · Categorized: Market Analysis · Tagged: bonds, FOMC, gamma, GLD, GOLD, interest rates, negative gamma, OPEX, SPX, TLT, volatility

Jun 09 2026

How Resistance at SPX 7,470 Set Up a Full-Profit Short Call Spread
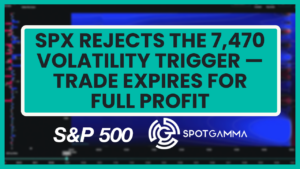
Doug-Pless-SpotGamma-SPX-Trade-June-2026

Understanding the prevailing gamma regime helps traders better anticipate price behavior for the names they trade. On June 9, SpotGamma’s TRACE heatmap showed positive gamma, indicating a lower-volatility, mean-reverting environment as SPX rallied. After HIRO confirmed rejection off a key level, traders aggressively sold calls and bought puts, forcing market makers to hedge by selling […]

Written by SpotGamma · Categorized: Case Study · Tagged: Case Study, Doug Pless, SPX

Apr 26 2026

How next week’s earnings could drive volatility
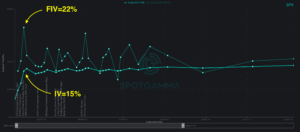
SPX implied volatility chart showing FIV at 22% and IV at 15% from late April through late July 2026.

Markets pushed to fresh all-time highs this week, driven by continued strength in AI stocks. One of the notable stores was SMH (the semiconductor ETF) which surged over 30% this month to cap 168% gain in the past year. While euphoric spirits have recently prevailed, next week brings an event-heavy calendar that might shift the […]

Written by Sherry An · Categorized: Market Analysis, SpotGamma Weekly · Tagged: call buying, call options, Convexity, dealer gamma, earnings, geopolitical risk, implied vol, iv, MSFT, rv, spotgamma weekly, SPX, volatility

Apr 19 2026

The Hidden Mechanics Behind Last Week’s Rally
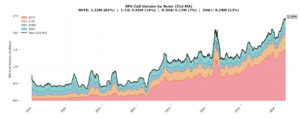
Stacked area chart showing SPX call volume by expiration tenor from 2019 to 2026, with total volume reaching 2.43 million contracts.

The S&P 500 has bounced back to record highs, closing decisively above 7,100 after Friday’s 1.2% rally. That marks a 12% rise from March lows in just under three weeks. In that same timeframe, volatility expectations have seemingly collapsed: VIX is down 40% since March 31, dropping from >30 to below 18. Crude oil has […]

Written by Simon Scholten · Categorized: Market Analysis, SpotGamma Weekly · Tagged: call buying, call options, dealer gamma, dealer positioning, geopolitical risk, implied vol, iv, OPEX, rv, spotgamma weekly, SPX, volatility

Apr 12 2026

Vol Crush Lifts the S&P 500 — Will the Rally Last?
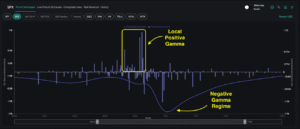
SPX gamma chart showing positive gamma peak near 6820 and negative gamma regime below 7020.

Following last week’s ceasefire announcement, the S&P 500 lifted 3% from roughly 6,550 to 6,800. On the surface, this rally looked like a meaningful shift toward risk-on sentiment as implied volatility collapsed rapidly across all expirations. Similarly, VIX plummeted below 20 for the first time in four weeks, marking one of its largest single-day declines ever. Yet […]

Written by Simon Scholten · Categorized: Market Analysis, SpotGamma Weekly · Tagged: dealer gamma, dealer positioning, geopolitical risk, implied vol, iv, negative gamma, OPEX, spotgamma weekly, SPX, vanna, vol crush, volatility

Apr 05 2026

How One Key Level Drove Last Week’s Rally
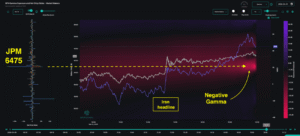
SPX gamma exposure and net OI chart showing price movement with negative gamma spike and Iran headline event on Mar 31, 2026.

The S&P 500 bounced back 2% last week after scraping against 6-month lows. Mixed headlines on the Iran conflict explained much of this tug-of-war, yet markets are still holding their breath. For many traders, the rally felt counterintuitive: How can equities rally so furiously if geopolitical uncertainties remain unresolved? When looking at Tuesday’s major bounce in […]

Written by Simon Scholten · Categorized: Market Analysis, SpotGamma Weekly · Tagged: dealer gamma, dealer positioning, FOMC, geopolitical risk, implied vol, iv, JPM Collar, negative gamma, OPEX, put skew, realized vol, spotgamma weekly, SPX, trace, volatility

Mar 29 2026

The New Volatility Regime

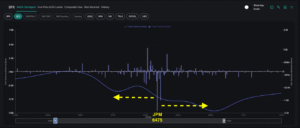
SPX options gamma chart showing total gamma line and bar chart with JPM strike at 6475 marked.

Over the past several weeks, we have consistently highlighted the market’s growing fragility. From the negative gamma “trapdoor” to the destabilizing impact of geopolitical shocks, the message has been clear: this is no longer a range-bound market. Last week confirmed those warnings, as the S&P 500 is down nearly 9% from all-time highs. On Thursday and Friday, traders […]

Written by Simon Scholten · Categorized: Market Analysis, SpotGamma Weekly · Tagged: dealer gamma, dealer positioning, geopolitical risk, implied vol, iv, negative gamma, realized vol, spotgamma weekly, SPX, Synthetic OI, VIX, volatility

Mar 22 2026

After OPEX: Market Loses Its Shock Absorber
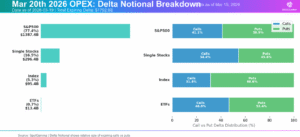
Stacked bar charts showing March 20, 2026 OPEX delta notional breakdown by asset class, with calls vs puts distribution percentages.

The options market has just cleared one of the largest structural events of the quarter, as Friday’s OPEX saw nearly $1.4 trillion in delta notional expire for the S&P 500. Because significant positions have now rolled off from the March expiration, the market has lost an important stabilizing force just as macro pressures begin to build. […]

Written by Simon Scholten · Categorized: Market Analysis, SpotGamma Weekly · Tagged: dealer gamma, dealer positioning, FOMC, geopolitical risk, implied vol, iv, negative gamma, OPEX, put skew, realized vol, spotgamma weekly, SPX, trace, VIX, volatility, Volatility Skew

  • « Go to Previous Page
  • Go to page 1
  • Go to page 2
  • Go to page 3
  • Go to page 4
  • Go to page 5
  • Go to Next Page »

Primary Sidebar

SpotGamma-Subscriber-Signup-Banner

  • CYTK: A $390K Options Bet Targets November FDA Catalyst
  • Why Option Premiums Look Too Thin To Sell
  • CPI Meets Positive Gamma: The SPX Levels That Could Determine the Next Move
  • The OPEX Effect: Put Selling Is Still Doing The Work
  • Banks Look for an Earnings Bounce Ahead
  • youtube
  • x
  • Privacy Policy
  • Disclaimer
  • Terms & Conditions
  • Support Center
  • Media
  • Contact Us

©2026 TenTen Capital LLC DBA SpotGamma

All SpotGamma materials, information, and presentations are for educational purposes only and should not be considered specific investment advice nor recommendations. Futures, foreign currency and options trading contains substantial risk and is not for every investor. An investor could potentially lose all or more than the initial investment. Risk capital is money that can be lost without jeopardizing one's financial security or lifestyle. Only risk capital should be used for trading and only those with sufficient risk capital should consider trading. Past performance is not necessarily indicative of future results. Testimonials appearing on this website may not be representative of other clients or customers and is not a guarantee of future performance or success.

View Full Risk Disclosure