• Skip to main content
  • Skip to primary sidebar

SpotGamma™

S&P 500 Stock Market Gamma Trading Levels Based on Options Open Interest

  • About
  • Pricing
  • Academy
  • Resources
    • Tool Demos
    • Case Studies
    • Blog
    • Support Center
    • Daily Report
    • Free Trading Tools
      • Opening Setup Free Report
      • Options Profit Calculator
      • SPX Gamma Exposure
      • Implied Earnings Moves
    • Free Training
    • Report Card
  • Login

SPX

Feb 08 2026

The Market’s 0DTE Underbelly Is Exposed
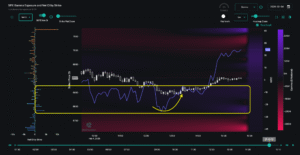
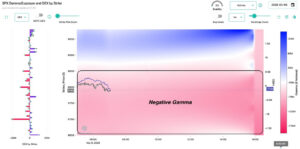
SPX options data showing strike prices, net open interest, and gamma exposure throughout trading hours on Feb 4, 2026.

Last week reminded us just how fast market stability can give way to volatility. After trading near all-time highs at 7,000, the S&P 500 fell 3% in just three sessions, closing Thursday at 6,798 amid weakness in software and crypto. Our last Sunday Newsletter focused specifically on how this type of fragility underscores today’s market. This […]

Written by Simon Scholten · Categorized: Market Analysis, SpotGamma Weekly · Tagged: FOMC, iv, OPEX, positive gamma, spotgamma weekly, SPX, VIX, volatility

Feb 01 2026

SPX Touches 7,000 and Cracks — What Makes This Market So Fragile?
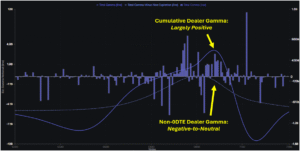
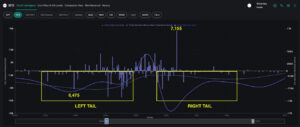
Chart showing cumulative dealer gamma (positive) and non-Odte dealer gamma (negative) across strike prices, with bars indicating gamma levels.

Market Fragility in the Face of All-Time Highs As the S&P 500 pushes record highs, the options market continues to flash warning signals beneath the surface. Underlying risk from volatility discrepancies and index-equity correlation suggest an environment prone to vol spasms — similar to what we witnessed with Thursday’s (1/29) sharp selloff and reversal. These […]

Written by Simon Scholten · Categorized: Market Analysis, SpotGamma Weekly · Tagged: FOMC, iv, OPEX, positive gamma, spotgamma weekly, SPX, VIX, volatility

Jan 25 2026

Vanna Fuels Market Rally as Market Fears Subside
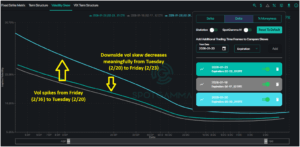
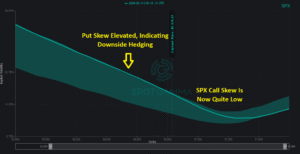
Volatility skew chart showing downside vol decreasing from Tuesday to Friday while upside vol spikes, with three comparable trading dates tracked.

Last week began with fear dominating market sentiment: analysts widely attributed Tuesday’s 2% SPX selloff to Greenland worries and tariff threats. As we pointed out in last weekend’s newsletter, traders had begun hedging against downside risk as put skew increased and volatility premiums rose. However, the quick turnaround back to SPX 6,900 seemed to erase any […]

Written by Simon Scholten · Categorized: Market Analysis, SpotGamma Weekly · Tagged: FOMC, iv, OPEX, positive gamma, spotgamma weekly, SPX, VIX, volatility

Jan 18 2026

Defensive Positioning Emerges as Market Rallies

VIX options chart showing total gamma and convexity across strike prices with negative gamma trend.

Traders Turn Defensive In the Face of Market’s Climb SPX tested fresh all-time highs last week, with positive gamma providing guardrails for the broader market. In the face of headline noise—from criminal investigations into Powell to Iran-related escalation—the market absorbed every dip, with the 6,890 Risk Pivot level from Monday’s AM Founder’s Note holding firm. However, increasing put skew and […]

Written by Simon Scholten · Categorized: Market Analysis, SpotGamma Weekly · Tagged: FOMC, iv, OPEX, positive gamma, spotgamma weekly, SPX, VIX, volatility

Jan 11 2026

Vol Stays Quiet as SPX Reaches All-Time Highs
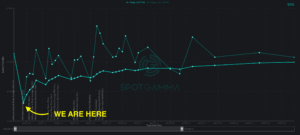
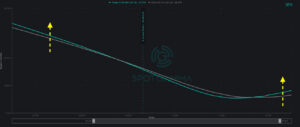
Dual-line chart tracking SPX implied volatility over time with annotation marking current position in early January 2026.

Strong 0DTE Support Lifts the Market to Record Highs The S&P 500 kicked off 2026 by grinding through a week of macro data releases to finish at fresh all-time highs on Friday. SPX closed at 6,966, up from the 6,902 open on Monday, after finding critical support in the 6,890–6,900 zone multiple times throughout the […]

Written by Simon Scholten · Categorized: Market Analysis, SpotGamma Weekly · Tagged: iv, OPEX, positive gamma, spotgamma weekly, SPX, trade example, volatility

Jan 04 2026

Record 0DTE volume reshapes the S&P 500

Dual-line chart tracking SPX implied volatility over time with annotation marking current position in early January 2026.

Record 0DTE Volume in 2025 Has Changed the Game We wrapped up 2025 with the S&P 500 up 18% for the year—a solid result in the face of tariff headlines, global conflicts, and inflation concerns. One of the major options market stories of the past year has been the growing role of 0DTE options: same-day expiration […]

Written by Simon Scholten · Categorized: Market Analysis, SpotGamma Weekly · Tagged: holiday, iv, negative gamma, OPEX, spotgamma weekly, SPX, trade example

Dec 21 2025

Subdued Volatility and the Setup Into Year-End

SPX put spread payoff diagram showing profit/loss across stock prices with Greeks and expiration details.

Subdued Vol Meets Negative Gamma Weakness in AI-related stocks dominated market headlines last week, most notably for Oracle and Broadcom. This pushed the market downward, before the rebound on Thursday and Friday. Despite the market trending down for three consecutive days, implied volatility remained surprisingly subdued: put skew remained average, and ATM implied volatility sat […]

Written by Simon Scholten · Categorized: Market Analysis, SpotGamma Weekly · Tagged: holiday, iv, negative gamma, OPEX, spotgamma weekly, SPX, trade example

Nov 13 2025

This SPX Trade Hit Big With 12:1 Reward-to-Risk Payoff Using TRACE & HIRO

Doug-Pless-SpotGamma-Case-Study-SPX-November-2025

Searching for high payout, same-day trades? See how professional trader Doug Pless sold a 0DTE SPX Iron Condor to exploit the negative gamma environment on November 13, 2025 — powered by TRACE, HIRO, and Key Gamma Levels. The result? A 12:1 reward-to-risk payoff. Here’s how: Author:  Doug Pless Professional Trader & SpotGamma Content Contributor The […]

Written by SpotGamma · Categorized: Case Study · Tagged: Case Study, Doug Pless, SPX

May 15 2025

Put-Covering Rallies & Signals in Our SPY Gamma Exposure (GEX)

Two candlestick charts of U.S. Dollar Index at 99.429 and S&P 500 Index at 5,387 with Bessent China tariffs headline.

The big question: Was that rally all put covering? Signals in SpotGamma’s custom SPY GEX say “Yes” This week the S&P500 rallied ~3% to close the Liberation Day downside price gap (red horizontal line). This led the S&P500 to notch a 9-day win streak – the longest such streak since November 2004. With that, the VIX […]

Written by SpotGamma · Categorized: Market Analysis · Tagged: market analysis, market makers, options flows, put calls, put rallies, SPX

May 13 2025

The Anatomy of an SPX 0DTE Driven Market

TRACE 0DTE Options

U.S. equities surged on May 12, 2025, as the S&P 500 closed +3% to 5,848, with intraday action reflecting a more modest 0.23% gain, after the U.S. and China agreed to a significant 90-day reduction in reciprocal tariffs. What did any of this have to do with 0DTE SPX options? Hint: The 0.23% intraday gain. The Anatomy […]

Written by SpotGamma · Categorized: Market Analysis · Tagged: 0DTE, cboe, SPX

  • « Go to Previous Page
  • Go to page 1
  • Go to page 2
  • Go to page 3
  • Go to page 4
  • Go to page 5
  • Go to Next Page »

Primary Sidebar

SpotGamma-Subscriber-Signup-Banner

  • The S&P500’s Diversification Problem
  • Quiet Oil Options Mask Tail Risk
  • Celsius Insiders Are Buying the Dip — And Options Are Cheap Into the Catalyst
  • Trump Xi Summit and the Market Outlook
  • AI Stocks Options Positioning: Call Selling, Not Put Buying
  • youtube
  • x
  • Privacy Policy
  • Disclaimer
  • Terms & Conditions
  • Support Center
  • Media
  • Contact Us

©2026 TenTen Capital LLC DBA SpotGamma

All SpotGamma materials, information, and presentations are for educational purposes only and should not be considered specific investment advice nor recommendations. Futures, foreign currency and options trading contains substantial risk and is not for every investor. An investor could potentially lose all or more than the initial investment. Risk capital is money that can be lost without jeopardizing one's financial security or lifestyle. Only risk capital should be used for trading and only those with sufficient risk capital should consider trading. Past performance is not necessarily indicative of future results. Testimonials appearing on this website may not be representative of other clients or customers and is not a guarantee of future performance or success.

View Full Risk Disclosure