• Skip to main content
  • Skip to primary sidebar

SpotGamma™

S&P 500 Stock Market Gamma Trading Levels Based on Options Open Interest

  • About
  • Pricing
  • Academy
  • Resources
    • Tool Demos
    • Case Studies
    • Blog
    • Support Center
    • Daily Report
    • Free Trading Tools
      • Opening Setup Free Report
      • Options Profit Calculator
      • SPX Gamma Exposure
      • Implied Earnings Moves
    • Free Training
    • Report Card
  • Login

TSLA

Dec 10 2020

TSLA Timeline into the S&P500 Add

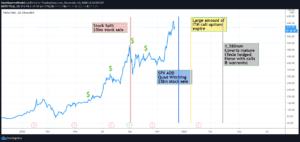
Daily Tesla line chart from 2020 to 2021 with annotations for stock split, SPX addition and options expirations.

TSLA will be added to the S&P500 Index next week, and will be approximately 1.5% of the index. We covered the mechanics of this add, here. The chart below highlights the key recent events, and some relevant future dates. The “$” markets indicate where Musk has received a bonus in the form of TSLA options. […]

Written by SpotGamma · Categorized: Market Analysis, Stock · Tagged: options delta, S&P500, TSLA

Nov 17 2020

TSLA Added to the S&P500

TSLA Added to SPX

Last night the S&P announced that TESLA (TSLA) would be added to the S&P500 (SPX) Index by Monday 12/21. What this effectively means is that anyone that has funds (pensions & other large asset managers) indexed to the S&P500 will need to purchase TSLA stock, and will sell whichever stock(s) TSLA is replacing(TBD). As TSLA […]

Written by SpotGamma · Categorized: Market Analysis, Stock · Tagged: S&P500, TSLA

Oct 22 2020

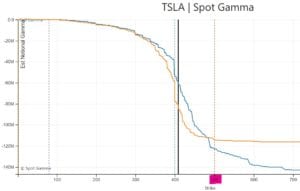
TSLA Has Less Spark

Line chart of TSLA estimated notional put and call gamma versus strike, both becoming more negative at higher strikes.

TSLA announced earnings last night which beat expectations and the stock reacted… fairly normally. No insane pops or drops. We think much of this tepid reaction is due to the relative lack of gamma compared to past earnings periods (see here). Below is a chart of the current gamma levels in TSLA, and you can […]

Written by SpotGamma · Categorized: Market Analysis, Stock · Tagged: TSLA

Jul 22 2020

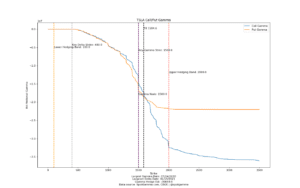
TSLA Options Pre Earnings

Line chart of TSLA call and put gamma versus strike with hedging bands at 100 and 2000.

TSLA reports earnings tonight, and there is a ton of options gamma to generate a large move tomorrow. We define key levels for the stock as follows: Lots of Gamma at 1500 – thats the “pivot” area where stock remains a bull above, bear below. There are a ton of in the money calls at […]

Written by SpotGamma · Categorized: Market Analysis, Stock · Tagged: earnings, expiration, gamma, TSLA

Jul 14 2020

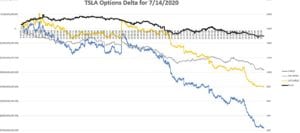
TSLA Options Deltas

Line chart of TSLA call, put and total options dollar deltas versus stock price on 7/14/2020.

We show TSLA having the 1500 as the key options strike going into Friday 7/17. The stock yesterday breached 1750 before pulling back to 1500. Its clear the options flow changed when the stock tagged that 1750 area as you can see in the chart at bottom. Friday will such and interesting date fore the […]

Written by SpotGamma · Categorized: Market Analysis, Stock · Tagged: delta, options gamma, TSLA

Jul 13 2020

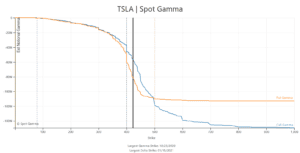
TSLA Convert Bonds Options & Gamma Traps
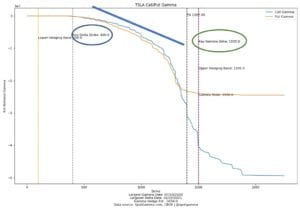
TSLA call/put gamma chart vs strike showing key delta 400, gamma strike 1500, and hedging bands at 100 and 1500.

We think that much of what has pushed TSLA’s massive runup in price has been a “gamma trap“. The idea being that in-the-money long calls and new long call positions force dealers to buy the stock as it goes higher. Our model detects a lot of very deep in the money <=400 strike calls, which […]

Written by SpotGamma · Categorized: Market Analysis, Stock · Tagged: convertible bonds, gamma trap, hedge, options gamma, TSLA

Jul 02 2020

Equity Options Gamma Shows Stretch

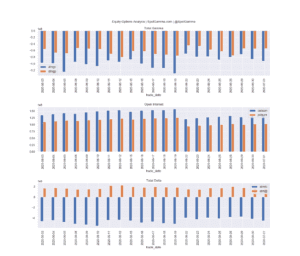
Three bar charts of total gamma, open interest and total delta for equity options in June-July 2020.

Our equity options gamma indicators are showing that negative gamma rates in single stocks are growing back to where record levels were a few weeks ago. Back then there was news of “record small trader” positions in call options. You can see there is a similar position below. In the charts below for TSLA, AMZN, […]

Written by SpotGamma · Categorized: Market Analysis · Tagged: AMZN, call positions, option gamma, TSLA

  • « Go to Previous Page
  • Go to page 1
  • Go to page 2
  • Go to page 3

Primary Sidebar

SpotGamma-Subscriber-Signup-Banner

  • Salesforce: A $1 Million Insider Buy Near a Key Options Level
  • Erasca’s November Catalyst: Promising Data, High Expectations and Strategic Optionality
  • NDX Call Skew Has Room While S&P Vol Contracts: Kochuba on tastylive
  • Costco Earnings: What Shoppers—and Options—Are Telling Us
  • The S&P500’s Diversification Problem
  • youtube
  • x
  • Privacy Policy
  • Disclaimer
  • Terms & Conditions
  • Support Center
  • Media
  • Contact Us

©2026 TenTen Capital LLC DBA SpotGamma

All SpotGamma materials, information, and presentations are for educational purposes only and should not be considered specific investment advice nor recommendations. Futures, foreign currency and options trading contains substantial risk and is not for every investor. An investor could potentially lose all or more than the initial investment. Risk capital is money that can be lost without jeopardizing one's financial security or lifestyle. Only risk capital should be used for trading and only those with sufficient risk capital should consider trading. Past performance is not necessarily indicative of future results. Testimonials appearing on this website may not be representative of other clients or customers and is not a guarantee of future performance or success.

View Full Risk Disclosure