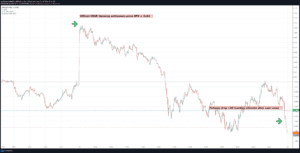
We ran a detailed analysis of the impact of same day options expiration volume vs open interest and the effect this may have on “pinning” the market into the close. Some may also refer to the idea as “options max pain”. You can read it here but we thought it was worth showing the effect […]
Market Analysis
Equity Options Gamma Shows Stretch
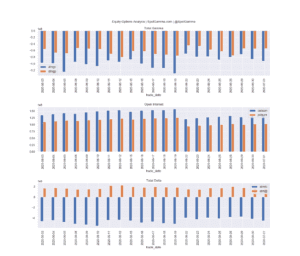
Our equity options gamma indicators are showing that negative gamma rates in single stocks are growing back to where record levels were a few weeks ago. Back then there was news of “record small trader” positions in call options. You can see there is a similar position below. In the charts below for TSLA, AMZN, […]
SPX Option Delta Tilt™ as an Indicator
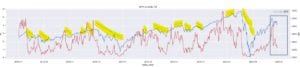
We have been studying SPX options deltas and changes in those deltas for some time. Finding a definitive indicator in this data has been a challenge, but there certainly appears to be something here. For this reason we are posting this current chart of our Delta Tilt™ indicator. Notice that large moves down in the […]
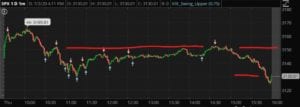
SpotGamma Levels at Work
We publish key levels based off of S&P500 options gamma and interest levels before the open. We can push these levels into various trading systems like Bookmap. As you can see in the Bookmap screenshot below the ES futures played off of our trading levels throughout the day. The market opened and immediately tested 3025 […]
SpotGamma Report for: 06/23/2020 PM
### You must be logged in to access this content. Don’t have an account with SpotGamma? Sign up today to view unique key levels, Founder’s Notes, market commentary, options analysis tools, and expert insights. If you’re already a SpotGamma subscriber, log in here: Username or E-mail Password Remember Me Forgot Password
Opex Quadwitching Rebalance Market Shenanigans
We are posting this as a reminder to all those that want to play in the market during large OPEX days also known as Quad Witching. Below is snapshot from the CBOE official settlement page. It shows an opening price of 3161 which is where all of the SPX AM options would officially be marked. […]
SPX Options Expiration vs Equities
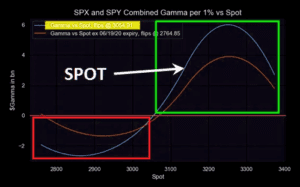
We spend a lot of time talking to our members about the lack of structure in the SPX options market. What we mean is the positioning in SPX options is just very small as seen in this chart below which maps total SPX call & put gamma. This has implications for markets not just at […]
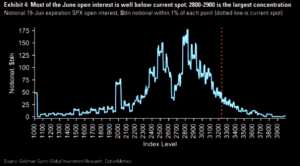
Nomura June OPEX Update

“Following Friday’s Serial/Quarterly options expiry, we continue to see potential for a ‘Gamma Unclenching’ over the following 1w-2w period with currently ~47% of the $Gamma set to run-off” – Nomura’s Charlie Nomura marks a much lower gamma flip point of June options expiration, which would suggest markets may open in more positive gamma territory after […]
Nomura 6/12/20 Gamma Update
Watch possible “gamma sweating” should this turn lower again Nomura’s quant explains the move yesterday; And here is why this this matters: as stated in the note to this point, yesterday was classic butterfly effect knock-on, with a “macro catalyst” from the COVID wave #2 risk-off trade which then triggered “profit-taking-turned-stop-loss selling” from both tactical […]
LaDuc Trading: Risk Parity, Market Gamma & Option-Driven Equity Flows
This is a repost from a great article written by our friends at LaDuc Trading. Follow Samantha @SamanthaLaDuc. Recall the 1% Risk Parity Trade of March? I wrote about it here: Gone Fishing Newsletter: The 1% Outlier Event That Tanked Equities 30% – Mar 24, 2020 Back on March 18th, the S&P 500 was down 16% in […]
