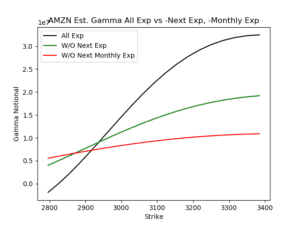
Below we show two styles of charts. The first (red, black, green lines) show how much gamma is tied to various expirations. The more gamma there is the more volatility these stocks may have. This is due to our assumption that stocks maintain a negative gamma stance as traders are primarily call buyers (and dealers […]
Market Analysis
Record Call Options at Record Prices
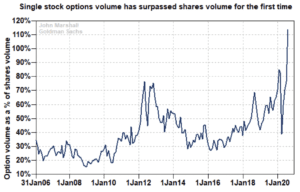
The following charts represent the most important dynamic in equity markets. It can be summarized by this: Massive call demand has pushed call prices way up, driving huge amounts of stock volume. Record levels of single stock call options were purchased into June expiration, reloaded back to record levels in July, and are now rebuilding […]
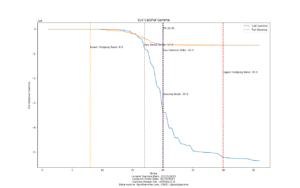
Nomura Gamma Update 7/23/20
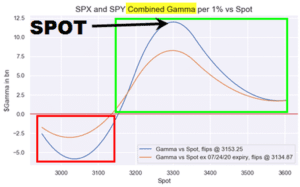
From ZH: Indeed, according to Nomura quant Charlie McElligott, after last month’s near-record Op-Ex, things are far more calm now and “3300 looks like the truth in Spooz, with nearly double the aggregate $Gamma ($4.5B) of the next closest line (3250 with $2.4B) as we head into expiry, thus exhibiting some “gravity” with Spooz up nearly 90 […]
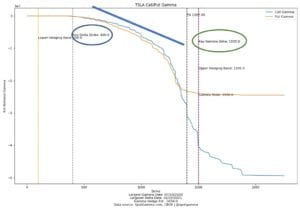
TSLA Options Pre Earnings
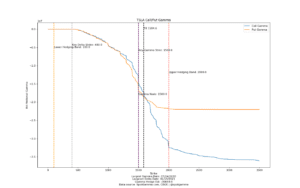
TSLA reports earnings tonight, and there is a ton of options gamma to generate a large move tomorrow. We define key levels for the stock as follows: Lots of Gamma at 1500 – thats the “pivot” area where stock remains a bull above, bear below. There are a ton of in the money calls at […]
Silver Has Some Gamma!
A few days ago we posted the following chart and comment on Twitter about the Silver ETF, SLV: $SLV running and could be gathering momentum. Seems like there are a fair a amount of calls up into 20’s. If those are net long calls that could help keep it running. I do have silver & […]
Where are the Calls?
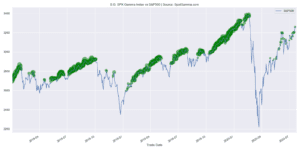
One of the things that has left us curious about the recent rally in SPX has been the lack of call positions. These call positions bring positive gamma to markets, which help to support the SPX. Our model suggests that in positive gamma markets options dealers are buying declines, and selling rallies therein “suppressing” volatility. […]
TSLA Options Deltas
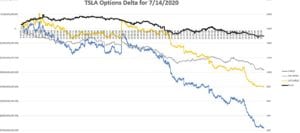
We show TSLA having the 1500 as the key options strike going into Friday 7/17. The stock yesterday breached 1750 before pulling back to 1500. Its clear the options flow changed when the stock tagged that 1750 area as you can see in the chart at bottom. Friday will such and interesting date fore the […]
The Power of Combo Strikes™
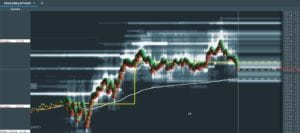
Our proprietary “Combo Strikes” which blend SPX and SPY interest have been great support/resistance lines for trading SPY, ES or SPX. You can see in our AM note highlighted below we marked 3136 (SPX) which is 3126 (ES) as a resistance level. Below is the quoted range from our AM premarket subscriber report. That level […]
TSLA Convert Bonds Options & Gamma Traps
We think that much of what has pushed TSLA’s massive runup in price has been a “gamma trap“. The idea being that in-the-money long calls and new long call positions force dealers to buy the stock as it goes higher. Our model detects a lot of very deep in the money <=400 strike calls, which […]
FAANG Options Expiration Gamma Pin
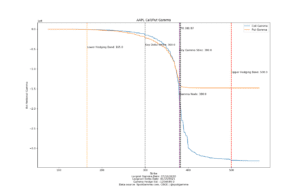
Our equity analysis models are in BETA but as we watch the data come in we pick up on a few interesting things. One of those was today when 4 our of the 5 FAANG (AAPL, AMZN, NFLX, GOOGL) names have their highest “gamma expiration” today: 7/10/20. Whats also interesting is that at the time […]
