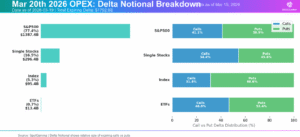
The options market has just cleared one of the largest structural events of the quarter, as Friday’s OPEX saw nearly $1.4 trillion in delta notional expire for the S&P 500. Because significant positions have now rolled off from the March expiration, the market has lost an important stabilizing force just as macro pressures begin to build. […]
volatility
VIX Expiration, Oil, and the JP Morgan Collar Trade: What’s Driving the S&P 500
Market Summary The market is entering a critical window where VIX expiration, quarterly options expiration, crude oil, and the JP Morgan collar trade are all colliding at once. The core argument is simple: implied volatility remains elevated while realized volatility has stayed unusually muted, and that mismatch may not last much longer. If oil continues […]
March OPEX: Tipping Point or Turning Point?
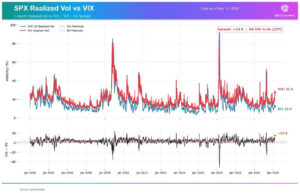
Fragility, Risk, and Potential Vol Reset As the S&P 500 enters OPEX week, we echo the same theme of the past few weeks: this market remains fragile. Last week’s selloff pushed the index below the three-month trading range of SPX 6,800-7,000 that had held since late 2025, subsequently closing down 5% since mid-January. The conflict with Iran continues […]
Geopolitical Risk Hits a Fragile Market
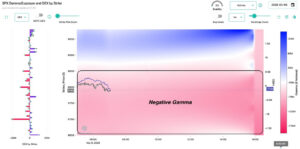
Markets entered last week on fragile footing. In our previous Sunday note, we emphasized how negative dealer gamma, extreme put skew, and heavy 0DTE options activity set the market up for a trapdoor scenario. This created a market structure vulnerable to sharp drops and spikes in volatility, as we saw play out last week. The dramatic […]
The Options Market Trapdoor
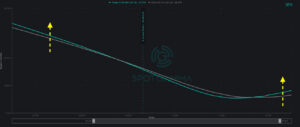
Over the past week, the topic of volatility has returned to the forefront. While the market has been largely range-bound, underlying support remains tenuous. Simultaneously, traders have begun more actively paying for downside protection. Given the backdrop of flaring geopolitical conflict, we see assymetric downside risk forming as trader uncertainty and negative gamma threaten to unlock the […]
Right Tail Risk Is Building in the S&P 500
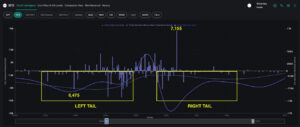
The market spent most of last week locked in the SPX 6,800–6,900 range that has largely held since Thanksgiving. Wednesday’s VIX expiration and Friday’s monthly OPEX defined the week’s rhythm, while negative gamma positioning and elevated single-stock put demand maintained pressure under the surface. Our historical OPEX data suggests the market is positioned for a […]
Flat Index Masks Hidden Chaos
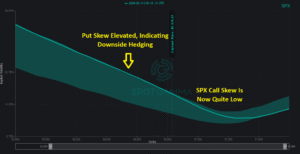
Overall price stability in the S&P 500 is masking one of the most unusual equity environments in recent years. While SPX has been roughly flat over the past month, the average constituent has moved 10.8% — a 99th percentile dispersion reading, as we discussed in our Thursday AM Founder’s Note. All signs point to increasing fragmentation beneath […]
The Market’s 0DTE Underbelly Is Exposed
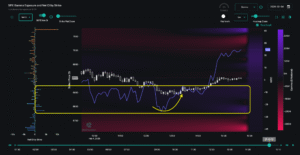
Last week reminded us just how fast market stability can give way to volatility. After trading near all-time highs at 7,000, the S&P 500 fell 3% in just three sessions, closing Thursday at 6,798 amid weakness in software and crypto. Our last Sunday Newsletter focused specifically on how this type of fragility underscores today’s market. This […]
SPX Touches 7,000 and Cracks — What Makes This Market So Fragile?
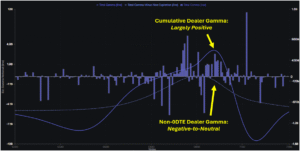
Market Fragility in the Face of All-Time Highs As the S&P 500 pushes record highs, the options market continues to flash warning signals beneath the surface. Underlying risk from volatility discrepancies and index-equity correlation suggest an environment prone to vol spasms — similar to what we witnessed with Thursday’s (1/29) sharp selloff and reversal. These […]
Vanna Fuels Market Rally as Market Fears Subside
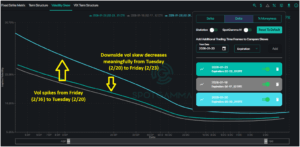
Last week began with fear dominating market sentiment: analysts widely attributed Tuesday’s 2% SPX selloff to Greenland worries and tariff threats. As we pointed out in last weekend’s newsletter, traders had begun hedging against downside risk as put skew increased and volatility premiums rose. However, the quick turnaround back to SPX 6,900 seemed to erase any […]