• Skip to main content
  • Skip to primary sidebar

SpotGamma™

S&P 500 Stock Market Gamma Trading Levels Based on Options Open Interest

  • About
  • Pricing
  • Academy
  • Resources
    • Tool Demos
    • Case Studies
    • Blog
    • Support Center
    • Daily Report
    • Free Trading Tools
      • Opening Setup Free Report
      • Options Profit Calculator
      • SPX Gamma Exposure
      • Implied Earnings Moves
    • Free Training
    • Report Card
  • Login

Market Analysis

Aug 30 2026

Software Earnings Reignite Risk Appetite

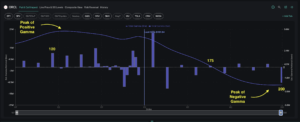
SPY options gamma chart showing strike levels 120, 175, and 200 with positive and negative gamma peaks.

Market sentiment was mixed last week following NVDA earnings and Jackson Hole. While NVDA’s solid outlook pushed the market to within inches of all-time highs, Warsh’s hawkish tone seemed to increase the probability of a September rate hike. Throughout August, the S&P 500 has closed in a narrow 2.6% band (SPX 7,600 – 7,800). The […]

Written by Sherry An · Categorized: Market Analysis, SpotGamma Weekly · Tagged: contango, CRM earnings, dealer gamma, forward implied volatility, Gamma Exposure, implied volatility, options positioning, options skew, ORCL options, semiconductor rotation, spotgamma weekly, SPX term structure, synthetic gamma

Aug 27 2026

Jackson Hole 2026: What the Options Market Expects
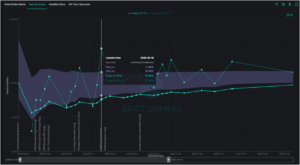
SPX term structure chart showing implied volatility from August to October 2026, with Fed Press Conference event marked on September 16.

SPY forward IV prices Jackson Hole as a non-event, but CTAs are stretched short Treasuries and SPX gamma flips near 7780 — an asymmetric setup into Friday.

Written by SpotGamma · Categorized: Market Analysis · Tagged: bonds, FOMC, gamma, GLD, GOLD, interest rates, negative gamma, OPEX, SPX, TLT, volatility

Aug 26 2026

One Stock, 803 ETFs: Why Nvidia Earnings Impacts the Entire S&P 500
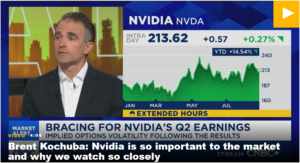
NVIDIA stock chart showing intraday price of 213.62 with YTD gain of 14.54% and volatility indicator for Q2 earnings.

Brent Kochuba joined CNBC to discuss Nvidia’s earnings, Salesforce, and how options traders repositioned across bond ETFs after comments from Treasury Secretary Bessent.

Written by SpotGamma · Categorized: Market Analysis · Tagged: earnings, Implied Move, NVDA, S&P 500, salesforce, TLT

Aug 25 2026

NVDA Earnings: The Options Market May Be Underpricing This Move
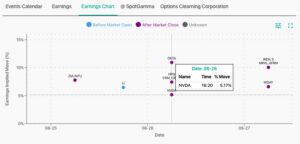
Earnings impact chart showing NVDA stock moved 5.17% on 08-26, with other earnings moves plotted across dates 08-25 to 08-27.

NVDA reports Wednesday after the close with the options market pricing a 5.5% move — below its 7.4% average realized move over the last 12 quarters. Dealers are short gamma above $220, call skew sits at the 81st percentile, and a distorted term structure opens up a calendar spread setup.

Written by SpotGamma · Categorized: Market Analysis · Tagged: call calendar, dealer gamma, Implied Move, NVDA, SpotGamma blog, volatility

Aug 23 2026

Volatility Has Compressed. What Happens Next?
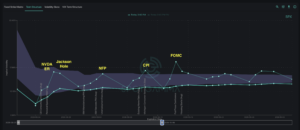
SPX term structure chart showing implied volatility declining from 32% to 10% across expiration dates through October 2026.

The S&P 500 pulled back slightly last week, and the market’s recent volatility compression phase appears ready for a reset. With earnings season largely over, both index and single stock volatility have dropped from the elevated levels that prevailed earlier this summer. Our pre-market Founder’s Note on Friday explained how substantial short-options positions cleared with […]

Written by Sherry An · Categorized: Market Analysis, SpotGamma Weekly · Tagged: contango, dealer gamma, forward implied volatility, Gamma Exposure, implied volatility, IWM put skew, Jackson Hole, Kevin Warsh, options positioning, options skew, QQQ call skew, spotgamma weekly, SPX term structure, synthetic gamma

Aug 20 2026

Another SpaceX Unlock, and Why $150 Still Caps the Stock
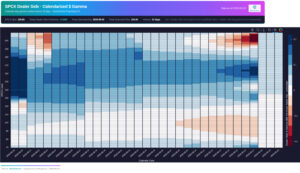
SPCX dealer side gamma heatmap showing calendar-day gamma surface across 33 days with strike prices from $70 to $200.

Roughly 300 million SpaceX shares came on the market Thursday, but no new stock was created and there is no dilution. The binding constraint on SPCX sits higher: call selling at and above spot has left dealers with positive gamma, making $150 the new ceiling.

Written by SpotGamma · Categorized: Market Analysis

Aug 17 2026

Options Exchange Monitor — Week of August 15, 2026 (36 SEC notices, 2 CFTC, 0 EDGAR)
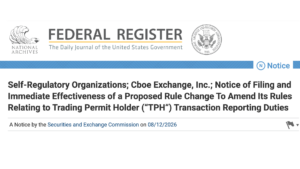
Federal Register notice header for SEC filing on CBOE Exchange trading permit holder transaction reporting rule changes, dated 08/12/2026.

SpotGamma tracks structural and regulatory changes in the U.S. options market: SEC SRO rule filings, CFTC actions, and OCC clearing notices. This update summarizes what changed and why it matters for options traders. Executive Summary OCC STAN Methodology Update (Doc 2026-15928) — APPROVED: The OCC has received SEC approval to incorporate options-implied interest rates as […]

Written by SpotGamma · Categorized: Market Analysis

Aug 17 2026

GEX Levels for SPY, QQQ, ES and NQ: Using Index Gamma in Any Product

Bearded man wearing glasses observes a candlestick chart with colored bars and technical indicators on a computer monitor.

How to use GEX levels when you trade SPY, QQQ, or ES/NQ futures: converting SPX and NDX gamma levels between products, why the structure transfers, and what changes for 0DTE and futures sessions.

Written by SpotGamma · Categorized: Market Analysis

Aug 17 2026

How to Trade GEX Levels: A Practical Guide to Gamma-Based Trading
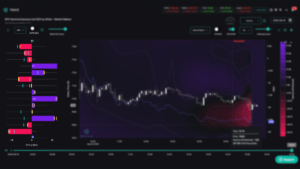
GEX options chain heatmap showing gamma exposure by strike price for QQTE-GEX with candlestick price chart overlay.

How do you actually trade GEX levels? Reading the gamma regime, using call and put walls as support and resistance, the zero gamma flip point, and how strategies change between positive and negative gamma.

Written by SpotGamma · Categorized: Market Analysis

Aug 17 2026

Free GEX Levels, Charts, and Data: What’s Available and What It’s Actually Worth
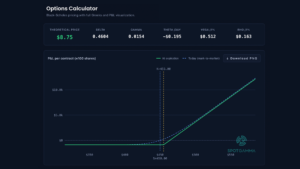
Black-Scholes options calculator showing Greeks and P&L chart with strike price at $450 and current price at $550.

Where to find free GEX levels, charts, and data — including SpotGamma’s free SPX gamma exposure tool — plus what free gamma data can and can’t tell you, and when it’s worth paying for more.

Written by SpotGamma · Categorized: Market Analysis

  • « Go to Previous Page
  • Go to page 1
  • Go to page 2
  • Go to page 3
  • Go to page 4
  • Go to page 5
  • Go to page 6
  • Interim pages omitted …
  • Go to page 65
  • Go to Next Page »

Primary Sidebar

SpotGamma-Subscriber-Signup-Banner

  • Index Put Protection Is Cheap With 10-Year Treasury Bonds at 5.3%
  • Friday Jobs Report Preview: What the Market Wants to See
  • Micron Earnings Preview: Can the AI Memory Boom Keep Delivering?
  • Index Put Demand Returns Ahead of Friday’s Jobs Report
  • AI Trade Drives Nasdaq, Small Caps Lag Behind
  • youtube
  • x
  • Privacy Policy
  • Disclaimer
  • Terms & Conditions
  • Support Center
  • Media
  • Contact Us

©2026 TenTen Capital LLC DBA SpotGamma

All SpotGamma materials, information, and presentations are for educational purposes only and should not be considered specific investment advice nor recommendations. Futures, foreign currency and options trading contains substantial risk and is not for every investor. An investor could potentially lose all or more than the initial investment. Risk capital is money that can be lost without jeopardizing one's financial security or lifestyle. Only risk capital should be used for trading and only those with sufficient risk capital should consider trading. Past performance is not necessarily indicative of future results. Testimonials appearing on this website may not be representative of other clients or customers and is not a guarantee of future performance or success.

View Full Risk Disclosure