• Skip to main content
  • Skip to primary sidebar

SpotGamma™

S&P 500 Stock Market Gamma Trading Levels Based on Options Open Interest

  • About
  • Pricing
  • Academy
  • Resources
    • Tool Demos
    • Case Studies
    • Blog
    • Support Center
    • Free Daily Report
    • Free Trading Tools
      • Options Profit Calculator
      • SPX Gamma Exposure
      • Implied Earnings Moves
      • Volatility Ranking
    • Free Training
    • Report Card
  • Login

Market Analysis

Apr 01 2026

GEX & JPM Collar: SpotGamma on TastyTrade

Brent SpotGamma talks with TastyTrade live about JPM Collar Trade, GEX and DEX

How Options Market Structure Controls Intraday Price Action: GEX, Dealer Hedging, and the JP Morgan Collar Trade Most traders watch price. Sophisticated traders watch flow. But the traders with real structural edge watch what dealers are forced to do — because when the biggest participants in the world’s largest options complex are compelled to hedge, markets move […]

Written by SpotGamma · Categorized: Market Analysis · Tagged: DEX, gamma hedging, GEX, hedging, JPM Collar

Mar 29 2026

The New Volatility Regime

Over the past several weeks, we have consistently highlighted the market’s growing fragility. From the negative gamma “trapdoor” to the destabilizing impact of geopolitical shocks, the message has been clear: this is no longer a range-bound market. Last week confirmed those warnings, as the S&P 500 is down nearly 9% from all-time highs. On Thursday and Friday, traders […]

Written by Simon Scholten · Categorized: Market Analysis, SpotGamma Weekly · Tagged: dealer gamma, dealer positioning, geopolitical risk, implied vol, iv, negative gamma, realized vol, spotgamma weekly, SPX, Synthetic OI, VIX, volatility

Mar 22 2026

After OPEX: Market Loses Its Shock Absorber

The options market has just cleared one of the largest structural events of the quarter, as Friday’s OPEX saw nearly $1.4 trillion in delta notional expire for the S&P 500. Because significant positions have now rolled off from the March expiration, the market has lost an important stabilizing force just as macro pressures begin to build. […]

Written by Simon Scholten · Categorized: Market Analysis, SpotGamma Weekly · Tagged: dealer gamma, dealer positioning, FOMC, geopolitical risk, implied vol, iv, negative gamma, OPEX, put skew, realized vol, spotgamma weekly, SPX, trace, VIX, volatility, Volatility Skew

Mar 22 2026

VIX Expiration, Oil, and the JP Morgan Collar Trade: What’s Driving the S&P 500

Market Summary The market is entering a critical window where VIX expiration, quarterly options expiration, crude oil, and the JP Morgan collar trade are all colliding at once. The core argument is simple: implied volatility remains elevated while realized volatility has stayed unusually muted, and that mismatch may not last much longer. If oil continues […]

Written by SpotGamma · Categorized: Market Analysis · Tagged: Iran, JPM Collar, oil, OPEX, Stock Market Crash, VIX, volatility

Mar 15 2026

March OPEX: Tipping Point or Turning Point?

Fragility, Risk, and Potential Vol Reset As the S&P 500 enters OPEX week, we echo the same theme of the past few weeks: this market remains fragile. Last week’s selloff pushed the index below the three-month trading range of SPX 6,800-7,000 that had held since late 2025, subsequently closing down 5% since mid-January. The conflict with Iran continues […]

Written by Simon Scholten · Categorized: Market Analysis, SpotGamma Weekly · Tagged: dealer gamma, dealer positioning, FOMC, geopolitical risk, implied vol, iv, negative gamma, put skew, realized vol, spotgamma weekly, SPX, trace, VIX, volatility, Volatility Skew

Mar 08 2026

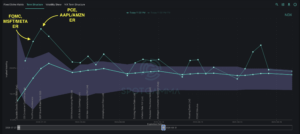
Geopolitical Risk Hits a Fragile Market

Markets entered last week on fragile footing. In our previous Sunday note, we emphasized how negative dealer gamma, extreme put skew, and heavy 0DTE options activity set the market up for a trapdoor scenario. This created a market structure vulnerable to sharp drops and spikes in volatility, as we saw play out last week. The dramatic […]

Written by Simon Scholten · Categorized: Market Analysis, SpotGamma Weekly · Tagged: Compass, dealer gamma, dealer positioning, forward implied volatility, forward-vol, geopolitical risk, iv, negative gamma, put skew, risk management, spotgamma weekly, SPX, Synthetic OI, trace, volatility, Volatility Skew

Mar 01 2026

The Options Market Trapdoor

Over the past week, the topic of volatility has returned to the forefront. While the market has been largely range-bound, underlying support remains tenuous. Simultaneously, traders have begun more actively paying for downside protection. Given the backdrop of flaring geopolitical conflict, we see assymetric downside risk forming as trader uncertainty and negative gamma threaten to unlock the […]

Written by Simon Scholten · Categorized: Market Analysis, SpotGamma Weekly · Tagged: call skew, Compass, dealer gamma, dealer positioning, iv, negative gamma, positive gamma, put skew, spotgamma weekly, SPX, Synthetic OI, volatility, Volatility Skew

Feb 26 2026

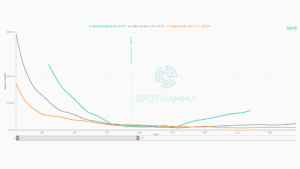
VVIX Explained: What the Volatility Index Tells Traders

VVIX Explained

The VVIX measures the expected volatility of the VIX itself — giving options traders a window into hedging demand, dealer positioning, and what the market is pricing before volatility materializes. SpotGamma’s forward return data shows
what elevated VVIX levels have historically meant for SPY and VIX.

Written by SpotGamma · Categorized: Market Analysis · Tagged: stock returns, VIX, VVIX

Feb 24 2026

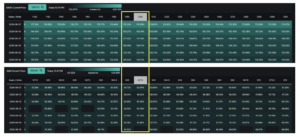
Earnings Options Trades With SpotGamma

Earnings options straddle for CRM

A strategic way to look at options trades into earnings, using SpotGamma’s institutional trading tools.

Written by SpotGamma · Categorized: Market Analysis · Tagged: earnings moves, earnings trades, implied volatility, IV Rank, options trades

Feb 22 2026

Right Tail Risk Is Building in the S&P 500

The market spent most of last week locked in the SPX 6,800–6,900 range that has largely held since Thanksgiving. Wednesday’s VIX expiration and Friday’s monthly OPEX defined the week’s rhythm, while negative gamma positioning and elevated single-stock put demand maintained pressure under the surface. Our historical OPEX data suggests the market is positioned for a […]

Written by Simon Scholten · Categorized: Market Analysis, SpotGamma Weekly · Tagged: Compass, dealer gamma, dealer positioning, iv, mag7, negative gamma, OPEX, positive gamma, spotgamma weekly, SPX, Synthetic OI, volatility

  • « Go to Previous Page
  • Go to page 1
  • Interim pages omitted …
  • Go to page 3
  • Go to page 4
  • Go to page 5
  • Go to page 6
  • Go to page 7
  • Interim pages omitted …
  • Go to page 62
  • Go to Next Page »

Primary Sidebar

SpotGamma-Subscriber-Signup-Banner

  • Another SpaceX Unlock, and Why $150 Still Caps the Stock
  • Options Exchange Monitor — Week of August 15, 2026 (36 SEC notices, 2 CFTC, 0 EDGAR)
  • GEX Levels for SPY, QQQ, ES and NQ: Using Index Gamma in Any Product
  • How to Trade GEX Levels: A Practical Guide to Gamma-Based Trading
  • Free GEX Levels, Charts, and Data: What’s Available and What It’s Actually Worth
  • youtube
  • x
  • Privacy Policy
  • Disclaimer
  • Terms & Conditions
  • Support Center
  • Media
  • Contact Us

©2026 TenTen Capital LLC DBA SpotGamma

All SpotGamma materials, information, and presentations are for educational purposes only and should not be considered specific investment advice nor recommendations. Futures, foreign currency and options trading contains substantial risk and is not for every investor. An investor could potentially lose all or more than the initial investment. Risk capital is money that can be lost without jeopardizing one's financial security or lifestyle. Only risk capital should be used for trading and only those with sufficient risk capital should consider trading. Past performance is not necessarily indicative of future results. Testimonials appearing on this website may not be representative of other clients or customers and is not a guarantee of future performance or success.

View Full Risk Disclosure