• Skip to main content
  • Skip to primary sidebar

SpotGamma™

S&P 500 Stock Market Gamma Trading Levels Based on Options Open Interest

  • About
  • Pricing
  • Academy
  • Resources
    • Tool Demos
    • Case Studies
    • Blog
    • Support Center
    • Daily Report
    • Free Trading Tools
      • Opening Setup Free Report
      • Options Profit Calculator
      • SPX Gamma Exposure
      • Implied Earnings Moves
    • Free Training
    • Report Card
  • Login

Market Analysis

Jul 22 2026

Space Stocks: Oversold Bounce or Ready for Liftoff?

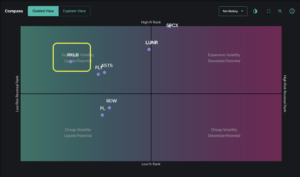
Compass chart showing space stock tickers positioned by IV rank and risk reversal, with RKLB highlighted in yellow box.

Last month, space stocks rocketed their way onto every trader’s radar. SpaceX’s record-breaking June IPO (SPCX) drew a wave of retail and institutional attention to the sector, while a string of NASA announcements made headline news and fueled several meaningful moves. Overall, the space sector has been defined by a notable downtrend in the past […]

Written by Sherry An · Categorized: Market Analysis, Stock · Tagged: dealer gamma, implied volatility, options market analysis, options positioning, put ratio spread, put skew, RKLB, Rocket Lab options, space stocks, SpaceX earnings, SpaceX IPO, SPCX

Jul 19 2026

Will the AI Unwind Finally Spill Over?
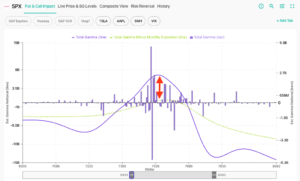
SPX put and call gamma impact chart showing strike prices 6935-8080 with total gamma line peaking near 7535 strike.

Last week delivered a string of constructive catalysts that supported the market through Thursday. Inflation ran cooler than expected, bank earnings impressed, retail sales beat, and ASML and TSM offered encouraging commentary towards semiconductor demand. While hostilities with Iran escalated, the market remained quite stable until Friday’s 1% drop following the Kimi-3 announcement. The stability […]

Written by Sherry An · Categorized: Market Analysis, SpotGamma Weekly · Tagged: AI trade unwind, dealer gamma, earnings implied move, earnings volatility, Gamma Exposure, implied volatility, INTC options, Intel earnings, July OPEX, Mag 7 earnings, market makers, options positioning, realized volatility, S&P 500 volatility, semiconductor stocks, spotgamma weekly, synthetic gamma

Jul 12 2026

Volatility Approaches Record Lows — Is It Priced Too Cheap?
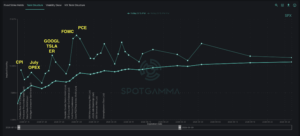
SPX term structure chart showing implied volatility curves from July through September 2026, with major events labeled.

The S&P 500 spent early July grinding higher with sector rotation quietly forming beneath a calm index. As SPX price action remained relatively muted over the past week, implied volatility dropped to near-record lows as of Friday: IV for contracts expiring next week now sit in the 6-10% range. Regardless of any directional bias for […]

Written by Sherry An · Categorized: Market Analysis, SpotGamma Weekly · Tagged: dealer gamma, earnings volatility, Gamma Exposure, implied volatility, July OPEX, market makers, Netflix options, NFLX earnings, options positioning, options term structure, options trading, realized volatility, S&P 500 volatility, spotgamma weekly, SPX put fly, synthetic gamma

Jul 07 2026

Why Nasdaq Volatility Is Breaking Away from the S&P 500
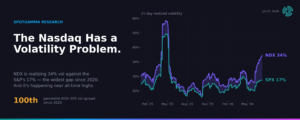
Chart comparing 21-day realized volatility of NDX at 34% versus SPX at 17% from February 2025 to July 2026.

Key Takeaways We believe the options market is signaling something much larger than a temporary volatility anomaly. The Nasdaq itself has structurally changed in the past year, with its year-to-date performance +16% vs +9% for the S&P500. Concentration, AI exposure, new index methodology, and options positioning have transformed it into a meaningfully different investment than […]

Written by SpotGamma · Categorized: Market Analysis

Jul 05 2026

Passing the Baton: From Semis to Software?
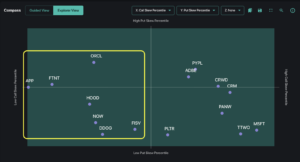
Scatter plot showing call and put skew percentiles for various stock tickers, with a highlighted cluster on the left side.

The AI trade has been the story of the first half of 2026, and semiconductors have been the main characters. The sector now accounts for roughly 20% of the entire S&P 500 — a historically high concentration. As we covered in our previous newsletter, any meaningful profit-taking in this area brings up the important question […]

Written by Sherry An · Categorized: Market Analysis, SpotGamma Weekly · Tagged: call skew, call spread strategy, earnings volatility, implied volatility, IV Rank, market makers, market volatility, options positioning, options trading, sector rotation, ServiceNow options, software stocks, SpotGamma Compass, spotgamma weekly, Volatility Skew

Jun 28 2026

July’s Setup: Rotation and Repositioning
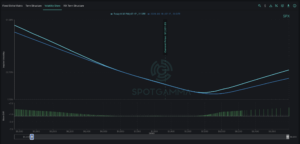
SPX volatility skew chart showing implied volatility curve across strike prices with current price level marked.

June lived up to its reputation as a volatile month with last week’s market drawdown. As we turn the page into July, the market now appears to be recalibrating positioning. Recent turbulence has driven capital rotation out of crowded tech leadership, and we now look for opportunities in alternative pockets of the market. In our […]

Written by Sherry An · Categorized: Market Analysis, SpotGamma Weekly · Tagged: Convexity, COR1M, forward-implied volatility, implied volatility, JPM Collar roll, market makers, market volatility, options positioning, options trading, SpotGamma Compass, spotgamma weekly, SPX gamma, SPX term structure, Volatility Skew

Jun 23 2026

Korean Options Mania: How AI, Retail Leverage, and Memory Stocks Turned South Korea Into the World’s Most Volatile Market
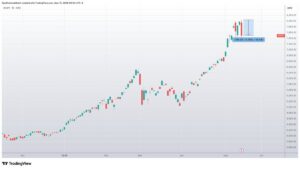
Daily candlestick chart showing KOSPI index rising from approximately 4,000 to 8,000 KRW between December 2025 and June 2026, with recent pullback highlighted.

South Korea’s options trading mania in 2026 is driven by AI memory stocks, record retail leverage, ELWs, and extreme volatility in Samsung and SK Hynix. Here’s what’s fueling the surge and why it matters globally.

Written by SpotGamma · Categorized: Market Analysis · Tagged: call options, KOSPI, Memory

Jun 21 2026

Vol Sellers Shrug off a Hawkish Fed

Line chart tracking SPX implied volatility across multiple expiration dates from June through August 2026, showing volatility decline over time.

Despite a hawkish Fed rattling equities midweek, the market easily and quickly retraced any lost ground by Thursday. With June OPEX now behind us and implied volatility reset toward recent lows, there is a soft feeling of “what’s next?” for the S&P 500 until earnings season ramps up next month. The June FOMC meeting on […]

Written by Sherry An · Categorized: Market Analysis, SpotGamma Weekly · Tagged: dealer hedging, FOMC, Gamma Exposure, hawkish Fed, implied volatility, JPM Collar roll, Kevin Warsh Fed, market makers, Micron earnings implied move, negative gamma, OPEX, SPCX options, spotgamma weekly, SPX term structure

Jun 14 2026

Triple Witching + FOMC Fuels Volatility Risk
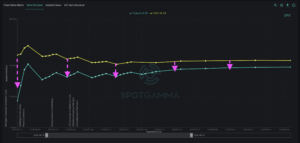
SPX term structure chart showing implied volatility and settlement levels from June to August 2026 with downward trend arrows.

The market delivered several volatile sessions last week as traders navigated Wednesday’s CPI inflation report, Friday’s massive SpaceX IPO (SPCX), and a mix of Iran-driven headlines throughout. Last Sunday, we wrote about how extreme options positioning into major catalysts could spark the exact volatile market behavior observed over the past several days. Tuesday’s wild 200-point […]

Written by Sherry An · Categorized: Market Analysis, SpotGamma Weekly · Tagged: dealer hedging, FOMC, Gamma Exposure, gold GLD outlook, implied volatility, Kevin Warsh Fed, market makers, negative gamma, OPEX, spotgamma weekly, SPX term structure, triple witching

Jun 07 2026

The AI Trade Unwinds

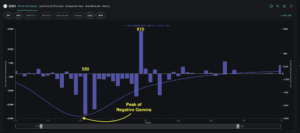
Total gamma bar chart with line showing peak negative gamma around 545 strike and positive gamma spike of 610 at higher strike levels.

Wall Street’s historic weekly winning streak came to an abrupt halt last week. On Friday, a sharp NFP report drove the S&P 500 down over 2.6%, leading to a sharp AI selloff and rising bond yields. Adding fuel to the fire, the market now appears to be pricing in a rate hike by the end […]

Written by Sherry An · Categorized: Market Analysis, SpotGamma Weekly · Tagged: AI trade unwind, dealer gamma, dealer hedging, Gamma Exposure, HIRO options flow, implied volatility, market makers, positive gamma, semiconductor selloff, SMH dealer gamma, spotgamma weekly, SPX options positioning, SPX term structure, volatility spasm

  • « Go to Previous Page
  • Go to page 1
  • Interim pages omitted …
  • Go to page 4
  • Go to page 5
  • Go to page 6
  • Go to page 7
  • Go to page 8
  • Interim pages omitted …
  • Go to page 65
  • Go to Next Page »

Primary Sidebar

SpotGamma-Subscriber-Signup-Banner

  • Index Put Protection Is Cheap With 10-Year Treasury Bonds at 5.3%
  • Friday Jobs Report Preview: What the Market Wants to See
  • Micron Earnings Preview: Can the AI Memory Boom Keep Delivering?
  • Index Put Demand Returns Ahead of Friday’s Jobs Report
  • AI Trade Drives Nasdaq, Small Caps Lag Behind
  • youtube
  • x
  • Privacy Policy
  • Disclaimer
  • Terms & Conditions
  • Support Center
  • Media
  • Contact Us

©2026 TenTen Capital LLC DBA SpotGamma

All SpotGamma materials, information, and presentations are for educational purposes only and should not be considered specific investment advice nor recommendations. Futures, foreign currency and options trading contains substantial risk and is not for every investor. An investor could potentially lose all or more than the initial investment. Risk capital is money that can be lost without jeopardizing one's financial security or lifestyle. Only risk capital should be used for trading and only those with sufficient risk capital should consider trading. Past performance is not necessarily indicative of future results. Testimonials appearing on this website may not be representative of other clients or customers and is not a guarantee of future performance or success.

View Full Risk Disclosure