• Skip to main content
  • Skip to primary sidebar

SpotGamma™

S&P 500 Stock Market Gamma Trading Levels Based on Options Open Interest

  • About
  • Pricing
  • Academy
  • Resources
    • Tool Demos
    • Case Studies
    • Blog
    • Support Center
    • Daily Report
    • Free Trading Tools
      • Opening Setup Free Report
      • Options Profit Calculator
      • SPX Gamma Exposure
      • Implied Earnings Moves
    • Free Training
    • Report Card
  • Login

Market Analysis

Sep 05 2019

Short Gamma vs Long Gamma

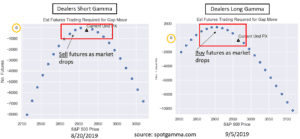
Two scatter plots comparing dealers short gamma on 8/20/2019 and long gamma on 9/5/2019 for S&P 500 futures.

As dealers were short gamma for most of August they have moved to long gamma. Below is a chart comparing their theoretical behavior in each gamma regime. You can see when dealers are short gamma and the market is falling they are trading with the market, fueling the drop. Conversely when long gamma they are […]

Written by SpotGamma · Categorized: Market Analysis · Tagged: dealer gamma, gamma trap, long gamma, options gamma, short gamma

Sep 03 2019

Starting Short Gamma – September Market Outlook
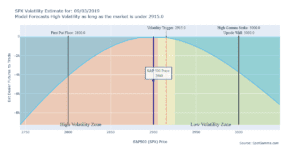
Volatility estimate chart for SPX on 09/03/2019 with high volatility zone below 2915 and price at 2900.

There are several catalysts in September that could cause the same volatility we saw in August. So far this morning there is appears that China Trade has made no headway and futures are around 2900. As you can see in the chart below that has the SPX & SPY markets starting short gamma and therefore […]

Written by SpotGamma · Categorized: Market Analysis · Tagged: options expiration, options market, short gamma, volatility

Aug 30 2019

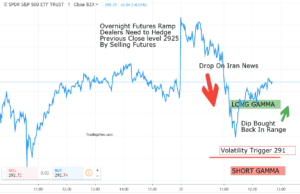
Long Gamma Kick Save 8/30/2019

Line chart of SPDR S&P 500 ETF TRUST with annotations for Iran news drop, long gamma rebound, and 291 volatility trigger.

There have been lots of short gamma charts lately but today’s action looked like a long gamma kick save. News about Iranian enrichment pushed the market down at ~11EST and there was a decent drop to ~291 – a dip that was bought. The previous close was 292.5 and we model that because of the […]

Written by SpotGamma · Categorized: Market Analysis · Tagged: long gamma, options gamma

Aug 27 2019

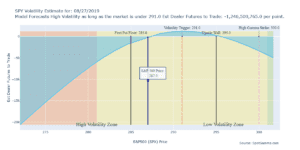
SPY Gamma Market Outlook

Line chart of estimated dealer futures vs SPX with high vol zone under 291 and labeled levels 285, 287, 291, 295, 300.

TradingView SPY Chart With Gamma Range Based on our options gamma model we see 285 in SPY as a decent support level due to size of put open interest. At the top of the range sits the volatility trigger level aka “zero gamma”. Options dealers will be buyers up to that level, but transition to […]

Written by SpotGamma · Categorized: Market Analysis · Tagged: options gamma, SPY

Aug 27 2019

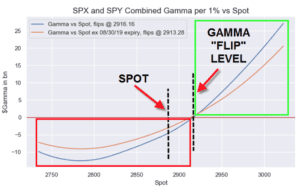
Nomura’s Latest Gamma Call 8/27/19

Line chart of SPX and SPY combined gamma versus spot, flipping from negative to positive near 2915.

Don’t consider this grandstanding, but it highlights an issue with people bent on constructing a narrative around models. Recently a Nomura analyst put out some great research but seemed to be bent on making it bullish, when the data clearly says neutral. Nomuras latest gamma call shows output similar to our model in that Gamma […]

Written by SpotGamma · Categorized: Market Analysis

Aug 27 2019

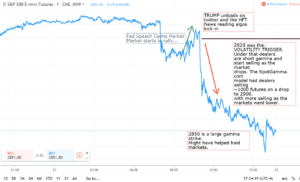
The Options Gamma Trap

S&P 500 E-mini futures line chart with a sharp drop after a rally, marked at 2920 and 2850.

Much has been made recently of the ominous “options gamma trap” and its potential effects in stock markets. What is an Options Gamma Trap? An options gamma trap is when options dealers are positioned “short gamma” and cause large swings in the stock market. To hedge a short gamma position you sell stock when the […]

Written by SpotGamma · Categorized: Market Analysis · Tagged: gamma trap, open interest, options gamma

Aug 26 2019

Pre Open Gamma Snapshot 8/26/19

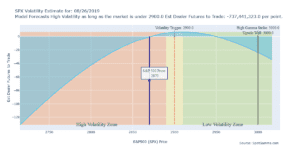
This line chart plots SPX dealer futures vs price with high vol below 2900, price 2870 and 3000 wall.

SpotGamma Model Outlook for today using a futures reference price of 2870. Dealers are short a healthy amount of gamma meaning they are going to fuel the market move at open. A short gamma position means a higher market means dealers will start buying and if the market drops at open they will sell along […]

Written by SpotGamma · Categorized: Market Analysis · Tagged: futures, gamma, open interest, options

Aug 25 2019

Notes From 8/24/2015 Crash

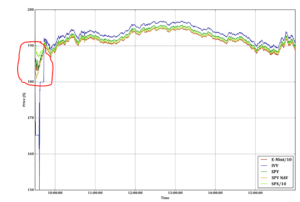
Line chart of E-Mini/10, IVV, SPY, SPY NAV and SPX/10 prices with a red-circled drop near 10:00.

Monday August 24th 2015 was a memorable day and it seemed like a good idea for a quick review given how much the current market seems to be trading. This is not a prediction for a market crash. There were a litany of reasons credited with causing the crash ( go here to see). Markets […]

Written by SpotGamma · Categorized: Market Analysis · Tagged: 8/24/2015, flash crash, market crash, SPX, SPY

Aug 23 2019

8/23/19 Stock Market Crash: Review of Friday Chaos

S&P 500 E-mini futures line chart with a sharp drop after a rally, marked at 2920 and 2850.

Quick review of days events through the SpotGamma model lens. Most of the notes from the 8/26/19 stock market crash are included in the graphic below. Essentially our model viewed this event as follows: Trumps Tweet about China caused a quick market drop that was compounded by dealers who were short gamma. This caused them […]

Written by SpotGamma · Categorized: Market Analysis · Tagged: 8/23/2019 market, short gamma, trump tweet

Aug 23 2019

“ALGOS” will Destroy the World! Gamma Traps and Liquidity

Good article here about active/passive investing and the thread of robots breaking the market. There is a good description of “gamma traps” and liquidity around options gamma. Two interesting pieces: When gamma is positive, options quickly get more valuable when the price of the related shares rise. The bank taking the opposite position to the […]

Written by SpotGamma · Categorized: Market Analysis · Tagged: futures, gamma trap, liquidity

  • « Go to Previous Page
  • Go to page 1
  • Interim pages omitted …
  • Go to page 65
  • Go to page 66
  • Go to page 67
  • Go to page 68
  • Go to page 69
  • Go to Next Page »

Primary Sidebar

SpotGamma-Subscriber-Signup-Banner

  • Right-Tail Risk On CNBC: The Larger Moves Have Come To The Upside
  • CYTK: A $390K Options Bet Targets November FDA Catalyst
  • Why Option Premiums Look Too Thin To Sell
  • CPI Meets Positive Gamma: The SPX Levels That Could Determine the Next Move
  • The OPEX Effect: Put Selling Is Still Doing The Work
  • youtube
  • x
  • Privacy Policy
  • Disclaimer
  • Terms & Conditions
  • Support Center
  • Media
  • Contact Us

©2026 TenTen Capital LLC DBA SpotGamma

All SpotGamma materials, information, and presentations are for educational purposes only and should not be considered specific investment advice nor recommendations. Futures, foreign currency and options trading contains substantial risk and is not for every investor. An investor could potentially lose all or more than the initial investment. Risk capital is money that can be lost without jeopardizing one's financial security or lifestyle. Only risk capital should be used for trading and only those with sufficient risk capital should consider trading. Past performance is not necessarily indicative of future results. Testimonials appearing on this website may not be representative of other clients or customers and is not a guarantee of future performance or success.

View Full Risk Disclosure