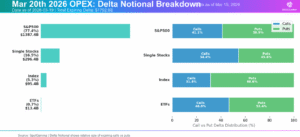
The options market has just cleared one of the largest structural events of the quarter, as Friday’s OPEX saw nearly $1.4 trillion in delta notional expire for the S&P 500. Because significant positions have now rolled off from the March expiration, the market has lost an important stabilizing force just as macro pressures begin to build. […]
dealer gamma
March OPEX: Tipping Point or Turning Point?
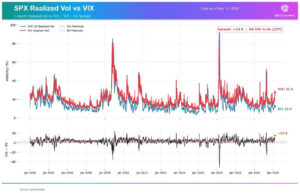
Fragility, Risk, and Potential Vol Reset As the S&P 500 enters OPEX week, we echo the same theme of the past few weeks: this market remains fragile. Last week’s selloff pushed the index below the three-month trading range of SPX 6,800-7,000 that had held since late 2025, subsequently closing down 5% since mid-January. The conflict with Iran continues […]
Geopolitical Risk Hits a Fragile Market
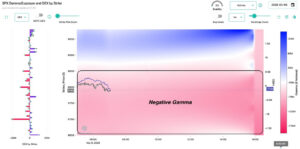
Markets entered last week on fragile footing. In our previous Sunday note, we emphasized how negative dealer gamma, extreme put skew, and heavy 0DTE options activity set the market up for a trapdoor scenario. This created a market structure vulnerable to sharp drops and spikes in volatility, as we saw play out last week. The dramatic […]
The Options Market Trapdoor
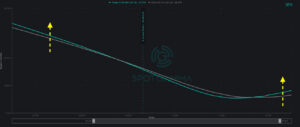
Over the past week, the topic of volatility has returned to the forefront. While the market has been largely range-bound, underlying support remains tenuous. Simultaneously, traders have begun more actively paying for downside protection. Given the backdrop of flaring geopolitical conflict, we see assymetric downside risk forming as trader uncertainty and negative gamma threaten to unlock the […]
Right Tail Risk Is Building in the S&P 500
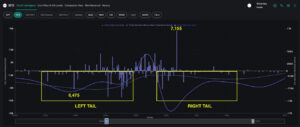
The market spent most of last week locked in the SPX 6,800–6,900 range that has largely held since Thanksgiving. Wednesday’s VIX expiration and Friday’s monthly OPEX defined the week’s rhythm, while negative gamma positioning and elevated single-stock put demand maintained pressure under the surface. Our historical OPEX data suggests the market is positioned for a […]
Gamma Before China Trade Talks
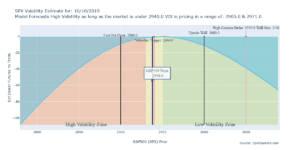
We started the day negative gamma but had a rally to just above the zero gamma level. There appears to be a sizeable market hedge at 2900 which could provide support for the markets. If volatility breaks the put hedges that dealers are holding will act as fuel to spark a strong rally. The 3000 […]
October’s Negative Gamma
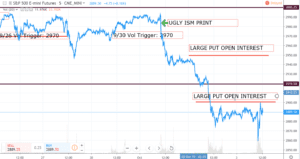
Here is a brief summary of the October Negative Gamma move so far. On 9/30 around the 3000 level in SPX we calculated a long gamma position for the market, but that quickly changed due to a very ugly ISM print. Once the market punched through the 2970 volatility trigger level, dealers fueled the selloff […]
Short Gamma vs Long Gamma
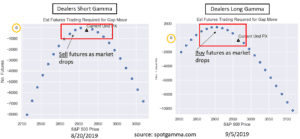
As dealers were short gamma for most of August they have moved to long gamma. Below is a chart comparing their theoretical behavior in each gamma regime. You can see when dealers are short gamma and the market is falling they are trading with the market, fueling the drop. Conversely when long gamma they are […]