• Skip to main content
  • Skip to primary sidebar

SpotGamma™

S&P 500 Stock Market Gamma Trading Levels Based on Options Open Interest

  • About
  • Pricing
  • Academy
  • Resources
    • Tool Demos
    • Case Studies
    • Blog
    • Support Center
    • Daily Report
    • Free Trading Tools
      • Opening Setup Free Report
      • Options Profit Calculator
      • SPX Gamma Exposure
      • Implied Earnings Moves
    • Free Training
    • Report Card
  • Login

nomura

Jan 07 2020

Nomura Gamma Report 1/7/20

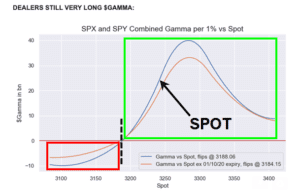
Line chart of SPX and SPY combined gamma per 1% vs spot, two curves, SPOT arrow, and red and green boxes.

Here is an updated Nomura gamma snapshot to compare vs ours. Note we both have gamma flip at ~3185 with peak gamma around 3275. He also sees 3250 as a “pin” much as we’ve shown in subscriber reports. Thanks to Heisenberg report. “And the same song remains—SPX Dealer ‘Gamma flip’ level is meaningfully below market”, […]

Written by SpotGamma · Categorized: Market Analysis · Tagged: gamma, gamma flip, nomura

Dec 20 2019

Nomuras Gamma Model 12/23/19

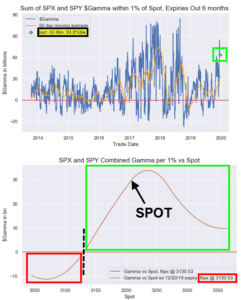
Two charts of SPX and SPY gamma: a time series ending at 42.4bn and a curve vs spot flipping at 3130.53.

We like to post Nomuras model snapshot here to compare against ours. Our volatility neutral indicator is lower, but the top matches. Some of this may be explained by Nomura combining SPY and SPX.

Written by SpotGamma · Categorized: Market Analysis · Tagged: gamma flip, market gamma, mcelligott, nomura

Dec 10 2019

Nomuras Pre-Event Gamma View

From heisenberg: Charlie McElligott, Nomura: “As VVIX & Skew went ‘bid’ BIG TIME yday, this indicates that the market is now once again beginning to price-in ‘tail’ scenarios”, “[That] offers attractive risk-reversal opportunities to play for an upside S&P breakout following a potential ‘hedge puke’”, he added, noting that in the event we do get […]

Written by SpotGamma · Categorized: Market Analysis · Tagged: deadline, gamma, mcgelligot, nomura, tariff

Dec 03 2019

Nomura’s Gamma December Note

Our model has gamma flipping at 3065, Nomuras is a bit higher. From ZeroHedge The interpretation of Trump’s “better to wait until after the election” for a China trade deal comments is that the Hong Kong human rights bill sponsorship by POTUS has clearly caused agitated the Chinese side (plus this morning’s Reuters report stating […]

Written by SpotGamma · Categorized: Market Analysis · Tagged: delta, gamma, gamma flip, mcgelligot, nomura

Nov 26 2019

Nomura’s McElligott Explains The ‘Perfect Virtuous Feedback Loop’ As Gamma Gravity Pins Equities “Intraday movement is squelched”.

From Heisenberg a great note from Nomura which syncs with what we wrote in recent weeks and to our subscribers. “Price movements over this summer once again clearly emphasized the spot/gamma/realized vol dynamics”, SocGen wrote, in a September note documenting a crucial dynamic that can always be described as “underappreciated” until everyone understands it. “All […]

Written by SpotGamma · Categorized: Market Analysis · Tagged: market gamma, mcelligott, nomura

Nov 22 2019

SpotGamma vs Nomura

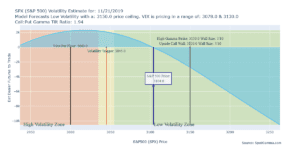
SPX volatility chart showing dealer futures vs price, high/low volatility zones, put floor at 3000 and call wall at 3150.

We like to post the banks gamma model output as way to check our own models. The two line up almost exactly. For now, US equities are “pinned” thanks to helpful greeks – at least until something really bad happens. “The fact remains that SPX will stay ‘sticky’ up here between the enormous 3100- ($9.4B […]

Written by SpotGamma · Categorized: Market Analysis · Tagged: gamma, mcgelligot, model compare, nomura

Nov 15 2019

Nomuras November Gamma Report

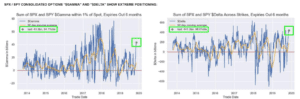
Two line charts of SPX and SPY gamma and delta from 2014 to 2020 highlighting recent extreme positioning.

From Heisneberg we get a glimpse into Nomuras gamma view, which seems to coincide with what we see. Namely gamma is about as high as we’ve ever seen, this past week hitting $2.7 billion compared to an all time high of ~$2.9bn in August of 2018. At the same time, investors have leaned into equities […]

Written by SpotGamma · Categorized: Market Analysis · Tagged: gamma, mcelligot, nomura

Oct 12 2019

Nomuras Gamma View after the Rally

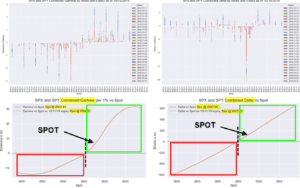
Four charts of SPX and SPY gamma and delta by strike/expiry and versus spot as of 10/10/2019.

Via Heisenberg, here is Nomuras Gamma View after the Rally. They note the following: “[The SPX was ]gravitationally pulled higher (spot 2970) and now sits comfortably between the two large $Gamma upside strikes of 3000 ($3.7B) and 2950 ($2.5B)”…“As the bullish macro catalysts have indeed begun materializing, the various hedge expressions (VIX upside, S&P downside, […]

Written by SpotGamma · Categorized: Market Analysis · Tagged: gamma, mcelligott, nomura, october rally

Oct 08 2019

SPX Distribution vs Gamma Levels

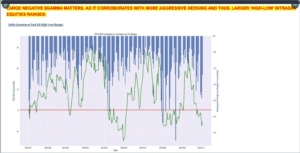
Dual-axis chart of SPX SPY gamma in billions (green line) and inverted 1-day high-low range (blue bars) in 2019.

from Heisenberg: you can see when gamma is large and positive the market moves much less than when gamma is large and negative.

Written by SpotGamma · Categorized: Market Analysis · Tagged: distribution, gamma, nomura

Sep 23 2019

Nomuras Options Gamma Update for September
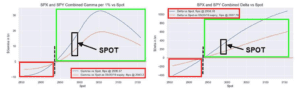
Two charts plot SPX and SPY combined gamma and delta against spot, highlighting flip levels and current SPOT.

The “Heisenberg Report” posts notes from Charles McElligott and his Nomura Options Gamma update for September. Its posted here to cross reference what our model derives. Now that the extreme long gamma dynamic that was pinning the index has rolled off, it’s possible things can start to move in earnest. On the upside, McElligott flags […]

Written by SpotGamma · Categorized: Market Analysis · Tagged: nomura, options gamma

  • « Go to Previous Page
  • Go to page 1
  • Interim pages omitted …
  • Go to page 3
  • Go to page 4
  • Go to page 5
  • Go to page 6
  • Go to Next Page »

Primary Sidebar

SpotGamma-Subscriber-Signup-Banner

  • The S&P500’s Diversification Problem
  • Quiet Oil Options Mask Tail Risk
  • Celsius Insiders Are Buying the Dip — And Options Are Cheap Into the Catalyst
  • Trump Xi Summit and the Market Outlook
  • AI Stocks Options Positioning: Call Selling, Not Put Buying
  • youtube
  • x
  • Privacy Policy
  • Disclaimer
  • Terms & Conditions
  • Support Center
  • Media
  • Contact Us

©2026 TenTen Capital LLC DBA SpotGamma

All SpotGamma materials, information, and presentations are for educational purposes only and should not be considered specific investment advice nor recommendations. Futures, foreign currency and options trading contains substantial risk and is not for every investor. An investor could potentially lose all or more than the initial investment. Risk capital is money that can be lost without jeopardizing one's financial security or lifestyle. Only risk capital should be used for trading and only those with sufficient risk capital should consider trading. Past performance is not necessarily indicative of future results. Testimonials appearing on this website may not be representative of other clients or customers and is not a guarantee of future performance or success.

View Full Risk Disclosure