Today (Friday 6/5) our stock options scanner picked up a large expiration in ZM options. ZM had earnings this week and this is likely why today has such a concentrated options expiration. Based on our model, we see that there is a large amount of Delta at the 200 strike that is set to expire. […]
Market Analysis
SG Combo Gamma Index In Action
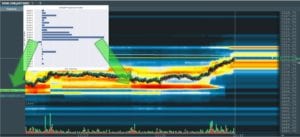
Our combined gamma SPX/SPY gives many fascinating levels for traders. As you can see in the chart the market will often use the large gamma strikes in this indicator as support and resistance areas. This proprietary indicator is for subscribers only.
Negative Gamma to the Upside
Pure speculation can drive markets higher. As you get people pouring into equities but also options. As investors buy long calls, that may force dealers (who are short those calls) to purchase the underlying. This is a gamma trap. Record retail account openings – CNBC Consider the video of this guy below. He used to […]
Speculators, Gamblers, Unite!
A strange thing has been happening in the options market recently, and I believe that is driving a lot of the intraday volatility we have been seeing. Yesterday (5/27) for instance, the S&P500 Index moved just under 100 total handles on the day. Take a look at the end of day snapshot of put volume […]
The Volatility Trigger for ES Futures Traders
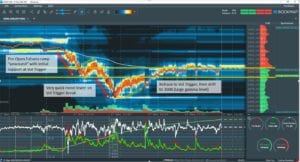
Wednesday 5/27 was a great example of how the Volatility Trigger can be a key level in trading. The concept of the volatility trigger is that when the market moves below the Trigger, options dealers are short gamma. This may mean that they start to sell futures as the market moves lower, and but futures […]
Overnight Outperforms?
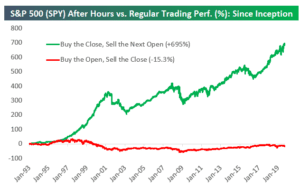
There is well knows research which shows that the overnight session in ES/SPX is the source of most of the positive market performance. This chart from Bespoke does a great job highlighting this. We have thought a lot about this, and had a theory that this out-performance may be due in part to options hedging […]
ZoneTraderPro Futures Trade Review
Our friends at ZoneTraderPro have a great trade review from Friday 5/22, where the incorporate SpotGamma levels into their unique ES futures trading signals and plan.
SpotGamma Presentation Futures Liquidity
Join SpotGamma & Trade To Win to talk about options levels and futures liquidity.
Attack of Risk Reversal
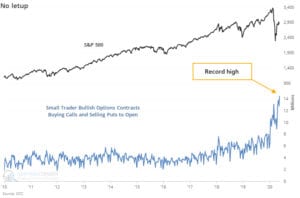
@SentimentTrader posted this chart showing record “small” positions in long calls and short puts. Sentiment says these are “10 contracts or fewer per trade”, insinuating retail traders. This type of trade (long call/short put) is a position also known as a risk reversal. While the traders are not likely actually trading short puts and long […]
Mondays Market SPX Slide 5/12/20
Yesterday markets fell apart pretty quickly and that leads us to highlight ES volume and the poor liquidity seen. You can see in the chart below that ES volume was higher than its recently been and a lot of that was concentrated into the close. This leads us to an interesting point about ES Futures […]
