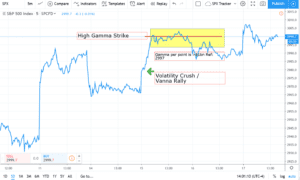
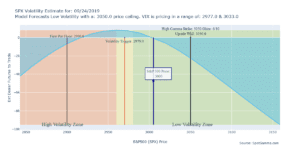
The current October options expiration portrays how an options pin can play out. For several days we have seen 3000 as our high gamma strike, with options volume at 3000 strike dominating the market. As the market moves away from this strike options dealers and other options hedgers move the price “back in line” to […]
Market Analysis
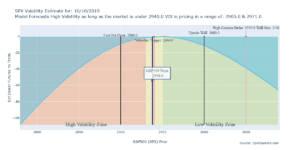
Mid October Rally
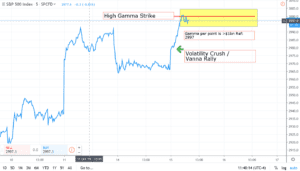
Here is a chart mapping out how we viewed this recent rally back up to 3000 in SPX, along with a bit of a prediction. The volatility crush sparked a rally today up to our “high gamma strike” of 3000. Because gamma is very high (~$1bn per S&P500 point) and 3000 is a high gamma […]
Nomuras Gamma View after the Rally
Via Heisenberg, here is Nomuras Gamma View after the Rally. They note the following: “[The SPX was ]gravitationally pulled higher (spot 2970) and now sits comfortably between the two large $Gamma upside strikes of 3000 ($3.7B) and 2950 ($2.5B)”…“As the bullish macro catalysts have indeed begun materializing, the various hedge expressions (VIX upside, S&P downside, […]
Options Vanna Rally
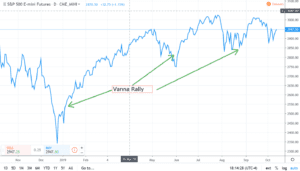
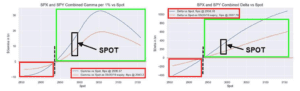
Now a prescient time to talk about options Vanna, and a Vanna rally. Vanna measures the change in delta for a change in Implied Volatility. Long calls + short puts = Long Vanna We view options market makers as typically long vanna. When volatility crushes they therefore must buy stock back to reduce their hedges. […]
Gamma Before China Trade Talks
We started the day negative gamma but had a rally to just above the zero gamma level. There appears to be a sizeable market hedge at 2900 which could provide support for the markets. If volatility breaks the put hedges that dealers are holding will act as fuel to spark a strong rally. The 3000 […]
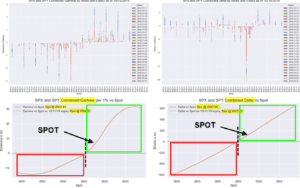
SPX Distribution vs Gamma Levels
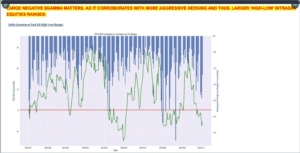
from Heisenberg: you can see when gamma is large and positive the market moves much less than when gamma is large and negative.
The Theory Behind Put Walls
For this example, 2900 in the S&P500 is identified as a strike with large put interest in SPX options. The theory behind Put Walls: We make an assumption that most of those puts were bought by hedgers, therefore market makers and dealers are short those 2900 puts. As a result they must short sell stock […]
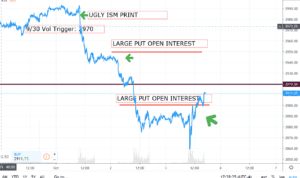
October’s Negative Gamma
Here is a brief summary of the October Negative Gamma move so far. On 9/30 around the 3000 level in SPX we calculated a long gamma position for the market, but that quickly changed due to a very ugly ISM print. Once the market punched through the 2970 volatility trigger level, dealers fueled the selloff […]
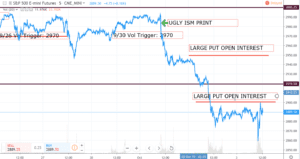
The “Impeachment” Gamma Trap
Going to Tuesday we noted 2970 as the 0 gamma volatility trigger and on Wednesday we pushed below that volatility trigger level indicating we should see some large moves in the SPX. The chart of the past two days in ES futures is here: Here was our gamma run from 9/24: After the close on […]
Dealer Gamma Bank Chart Pack
As “dealer gamma” seems to becoming more prevalent there are more charts from various banks leaking out to the retail public. Here is a compilation of a few: Nomura more or less matches ours, but they combine SPX and SPY into one chart whereas we prefer to keep them separate. Morgans Stanley’s dealer gamma seems […]
