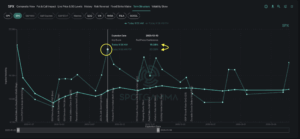
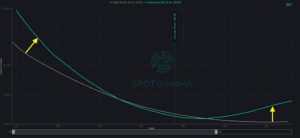
Using Options to Evaluate Rate-Sensitive Names With last week bringing realized volatility to the highest levels seen in 6 months, the market has entered a highly reactive state. Market events and data releases each have the potential to change the outlook for direction and volatility—and the December 10 FOMC remains the biggest date on the […]
gamma
Crypto Winter or Santa Claus Rally: Which Comes Next?
Evaluating IBIT with Positional Analysis Crypto markets have faced serious selling pressure this past month, and last Friday’s sharp decline pushed Bitcoin to yearly lows near $80K. BTC is now on track for its worst monthly performance since 2022—down 22% over the past month and negative for the year. Using Positional Analysis, we can examine […]
The Sell-off For The NASDAQ May Not Be Over Yet
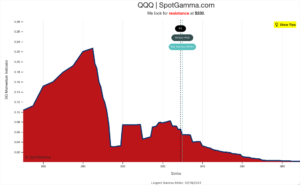
The following is a guest post courtesy of Michael Kramer of Mott Capital Management. With the Fed pivoting to a very hawkish stance starting in 2022, the Nasdaq has witnessed a dramatic decline of nearly 18% since peaking in November. The drop may only continue in the weeks ahead as market participants try to figure out the potential […]
‘Call AAA’: Santa Claus Is Having Sleigh Troubles
Through an options market lens, the following text will add color to some recent market movements.
New Look: Total Gamma (Absolute Gamma) Charts
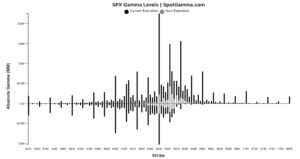
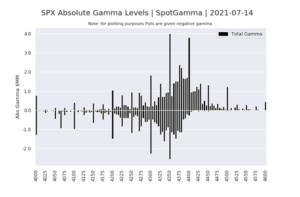
We’ve upgraded our Total Gamma AKA Absolute Gamma Charts. These charts display the total gamma by strike for calls (reflected as a positive gamma bar) and puts (shown as a negative gamma bar). Additionally we’ve added a feature which shows how much of that strike’s gamma is positioned in the next expiration (light grey). This […]
The Unclenching Of Gamma May Unleash The Overbought Stock Market
The following post is courtesy of Michael Kramer of Mott Capital Management. Reach him on Twitter. Since the big June options expiration, US equity markets have run sharply higher. Starting on June 18, the S&P 500 has gained an unexpected 5%. The move higher has come despite many economic reports suggesting the economy may have […]
“Banging Between Big Strikes” – Levels To Watch Ahead Of FOMC Statement
BY TYLER DURDENWEDNESDAY, APR 28, 2021 – 01:25 PM As we detailed overnight, today’s FOMC is widely expected to be “steady as she goes” with Biden conveying that the FOMC is not yet thinking about shifting its dovish stance. The only “risk” associated with today could be a “semantics” acknowledgement of better data (though we note the […]
Pre FOMC Nomura Gamma Update
From ZH: With less than 24 hours to go until one of the most closely watch Fed announcements in a long time, the VIX finds itself hanging just below 20, the gamma gravity in the S&P is at 4,000 while dealers remains short Nasdaq/QQQ gamma (which however is shrinking by the day). In short, depending […]
TSLA into the S&P500
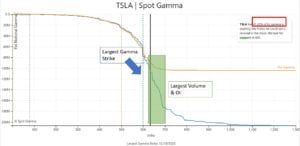
In TSLA the largest gamma area was $600 heading into today. The stock traded down to $605 earlier this AM, $620 now. The largest volume & OI region is >=$650 44% of TSLA gamma exp on close of12/18, by which time ~$50bn of TSLA stock needs to be bought by S&P indexers
JPM Gamma Update
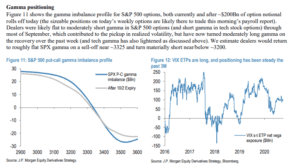
We present updated gamma figures from JPM this morning. It syncs with our AM note that 3300 is the key level.
