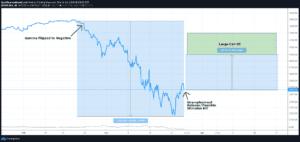
This is being written just before the 3/26 unemployment data release which is forecasting as much as 2 million unemployment due to the economic shutdown related to Coronavirus. There is also a Stimulus Bill “pending“. While we are all aware of the downside risks here, here is a scenario for a major move to the […]
negative gamma
SpotGamma Report for: 03/13/2020 AM
### You must be logged in to access this content. Don’t have an account with SpotGamma? Sign up today to view unique key levels, Founder’s Notes, market commentary, options analysis tools, and expert insights. If you’re already a SpotGamma subscriber, log in here: Username or E-mail Password Remember Me Forgot Password
The Friday Option Position “Blowout”
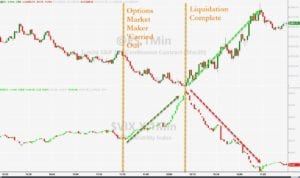
ZeroHedge posted an article Friday that caught a lot of attention. Basically they claim that a firm got a tap on the shoulder from the risk department and were forced to close out positions. This may also have been a Margin Call. If someone got tagged (allegedly) doesn’t really matter to us, what happened in […]
Poor Liquidity & Negative Gamma: Volatile Stuff
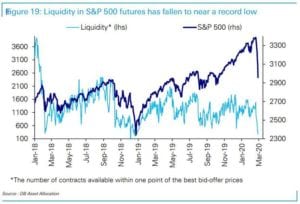
We’ve written extensively about negative gamma and poor liquidity during volatile markets, and wanted to post some of those effects in real time. ZH posted an article framing how bad liquidity in ES futures is, note the chart below: as the following chart from Deutsche Bank shows, overall liquidity for S&P500 futures has fallen to all […]
SpotGamma 2/24/20 AM Report
We’ve moved well through the zero gamma area and are testing the first “put wall” and “absolute gamma strike”. Puts are now in control of gamma which indicates more volatility ahead. I would not look at the put wall as a solid support line, but more of a pivot or “band” around which larger moves […]
Volume vs Dealer Gamma
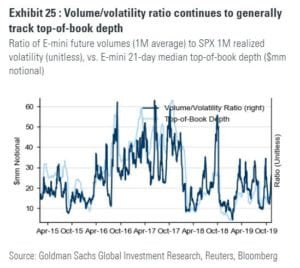
As volatility spikes S&P E-mini top of book depth decreases. Anecdotally this doesn’t come as a surprise because higher volatility should make dealers reduce size and be less aggressive. Whats interesting is that (in theory) in a negative gamma world options hedgers don’t reduce their size, so they just face less liquidity which means their […]
Options Vanna Rally
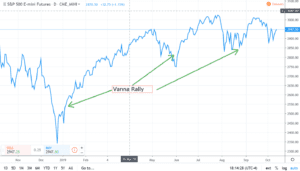
Now a prescient time to talk about options Vanna, and a Vanna rally. Vanna measures the change in delta for a change in Implied Volatility. Long calls + short puts = Long Vanna We view options market makers as typically long vanna. When volatility crushes they therefore must buy stock back to reduce their hedges. […]
Gamma Before China Trade Talks
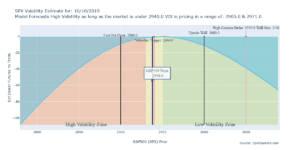
We started the day negative gamma but had a rally to just above the zero gamma level. There appears to be a sizeable market hedge at 2900 which could provide support for the markets. If volatility breaks the put hedges that dealers are holding will act as fuel to spark a strong rally. The 3000 […]
The Theory Behind Put Walls
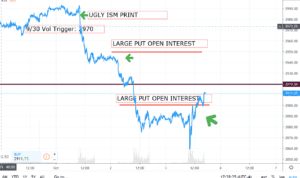
For this example, 2900 in the S&P500 is identified as a strike with large put interest in SPX options. The theory behind Put Walls: We make an assumption that most of those puts were bought by hedgers, therefore market makers and dealers are short those 2900 puts. As a result they must short sell stock […]
October’s Negative Gamma
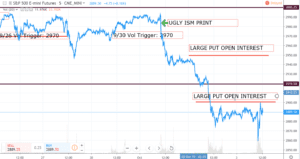
Here is a brief summary of the October Negative Gamma move so far. On 9/30 around the 3000 level in SPX we calculated a long gamma position for the market, but that quickly changed due to a very ugly ISM print. Once the market punched through the 2970 volatility trigger level, dealers fueled the selloff […]