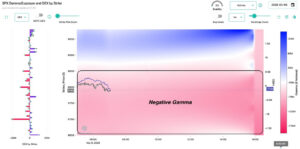
Markets entered last week on fragile footing. In our previous Sunday note, we emphasized how negative dealer gamma, extreme put skew, and heavy 0DTE options activity set the market up for a trapdoor scenario. This created a market structure vulnerable to sharp drops and spikes in volatility, as we saw play out last week. The dramatic […]
negative gamma
The Options Market Trapdoor
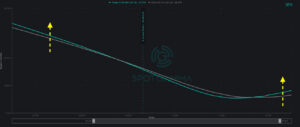
Over the past week, the topic of volatility has returned to the forefront. While the market has been largely range-bound, underlying support remains tenuous. Simultaneously, traders have begun more actively paying for downside protection. Given the backdrop of flaring geopolitical conflict, we see assymetric downside risk forming as trader uncertainty and negative gamma threaten to unlock the […]
Right Tail Risk Is Building in the S&P 500
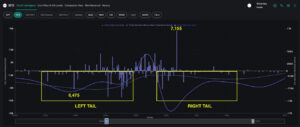
The market spent most of last week locked in the SPX 6,800–6,900 range that has largely held since Thanksgiving. Wednesday’s VIX expiration and Friday’s monthly OPEX defined the week’s rhythm, while negative gamma positioning and elevated single-stock put demand maintained pressure under the surface. Our historical OPEX data suggests the market is positioned for a […]
Record 0DTE volume reshapes the S&P 500
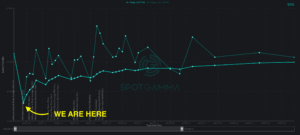
Record 0DTE Volume in 2025 Has Changed the Game We wrapped up 2025 with the S&P 500 up 18% for the year—a solid result in the face of tariff headlines, global conflicts, and inflation concerns. One of the major options market stories of the past year has been the growing role of 0DTE options: same-day expiration […]
Subdued Volatility and the Setup Into Year-End
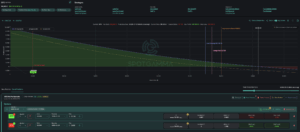
Subdued Vol Meets Negative Gamma Weakness in AI-related stocks dominated market headlines last week, most notably for Oracle and Broadcom. This pushed the market downward, before the rebound on Thursday and Friday. Despite the market trending down for three consecutive days, implied volatility remained surprisingly subdued: put skew remained average, and ATM implied volatility sat […]
FOMC Reset: Vol Crushes, Stocks Lift Higher

Last week began with quiet anticipation of Wednesday’s FOMC. When the Fed announced the 25 basis point rate cut and Treasury bill purchases, the reaction was immediate. Equities surged, with the SPX breaking out above our 6,845 Volatility Trigger to approach all-time-highs near the 6,900 resistance level. The options market had priced in meaningful event-related volatility surrounding FOMC, and […]
Nomura: “Max Short Gamma” Pain… But Relief Is Coming
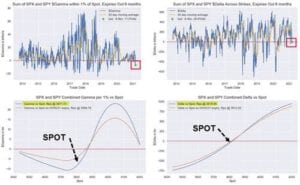
Via ZH: Earlier this week we pointed out a bizarre divergence in the “greeks” – while the Nasdaq had slumped into negative gamma territory, which is where dealers are forced to sell more as the Nasdaq slides lower creating a feedback loop where selling begets selling, even as the S&P still remained in positive gamma […]
Nomura June OPEX Update
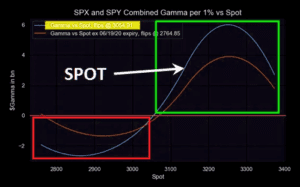
“Following Friday’s Serial/Quarterly options expiry, we continue to see potential for a ‘Gamma Unclenching’ over the following 1w-2w period with currently ~47% of the $Gamma set to run-off” – Nomura’s Charlie Nomura marks a much lower gamma flip point of June options expiration, which would suggest markets may open in more positive gamma territory after […]
June Selloff Review
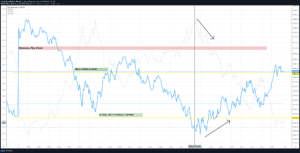
Markets were unable to hold gains on Friday after a sharp selloff on Thursday. While we initially opened over the gamma flip zone, markets broke that 3075 area and immediately sold down to the 3000 strike. This 3000 level is where we calculated the most options gamma and served as support. All of these levels […]
Zero Gamma = Zero Gravity
We posted a few days ago about the “right” tail risk and the possibility of a market rally. In a note to subscribers we added to this, suggesting the market may be in an airpocket. Specifically: “zero gravity”. Most of you are probably familiar with those flights which take you to the edge of space […]