• Skip to main content
  • Skip to primary sidebar

SpotGamma™

S&P 500 Stock Market Gamma Trading Levels Based on Options Open Interest

  • About
  • Pricing
  • Academy
  • Resources
    • Tool Demos
    • Case Studies
    • Blog
    • Support Center
    • Daily Report
    • Free Trading Tools
      • Opening Setup Free Report
      • Options Profit Calculator
      • SPX Gamma Exposure
      • Implied Earnings Moves
    • Free Training
    • Report Card
  • Login

Market Analysis

Apr 27 2026

How to Trade GEX Flips: An Intraday Masterclass Using SpotGamma TRACE

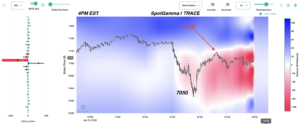
SpotGamma TRACE chart showing intraday GEX flip and negative gamma pocket.

One of the most profitable setups in options-land is the GEX Flip—the moment a market transitions from a stable, “pinned” environment into a high-volatility “squeeze” or “slide.” Using the TRACE charts from April 23, 2026, we can see exactly how this transition occurs in real-time. Stage 1: The Stable Open (9:30 AM EST) At the […]

Written by SpotGamma · Categorized: Market Analysis

Apr 26 2026

How next week’s earnings could drive volatility
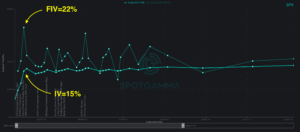
SPX implied volatility chart showing FIV at 22% and IV at 15% from late April through late July 2026.

Markets pushed to fresh all-time highs this week, driven by continued strength in AI stocks. One of the notable stores was SMH (the semiconductor ETF) which surged over 30% this month to cap 168% gain in the past year. While euphoric spirits have recently prevailed, next week brings an event-heavy calendar that might shift the […]

Written by Sherry An · Categorized: Market Analysis, SpotGamma Weekly · Tagged: call buying, call options, Convexity, dealer gamma, earnings, geopolitical risk, implied vol, iv, MSFT, rv, spotgamma weekly, SPX, volatility

Apr 19 2026

The Hidden Mechanics Behind Last Week’s Rally
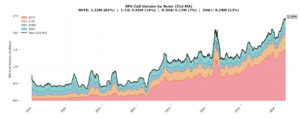
Stacked area chart showing SPX call volume by expiration tenor from 2019 to 2026, with total volume reaching 2.43 million contracts.

The S&P 500 has bounced back to record highs, closing decisively above 7,100 after Friday’s 1.2% rally. That marks a 12% rise from March lows in just under three weeks. In that same timeframe, volatility expectations have seemingly collapsed: VIX is down 40% since March 31, dropping from >30 to below 18. Crude oil has […]

Written by Simon Scholten · Categorized: Market Analysis, SpotGamma Weekly · Tagged: call buying, call options, dealer gamma, dealer positioning, geopolitical risk, implied vol, iv, OPEX, rv, spotgamma weekly, SPX, volatility

Apr 12 2026

Vol Crush Lifts the S&P 500 — Will the Rally Last?
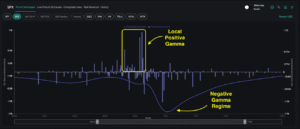
SPX gamma chart showing positive gamma peak near 6820 and negative gamma regime below 7020.

Following last week’s ceasefire announcement, the S&P 500 lifted 3% from roughly 6,550 to 6,800. On the surface, this rally looked like a meaningful shift toward risk-on sentiment as implied volatility collapsed rapidly across all expirations. Similarly, VIX plummeted below 20 for the first time in four weeks, marking one of its largest single-day declines ever. Yet […]

Written by Simon Scholten · Categorized: Market Analysis, SpotGamma Weekly · Tagged: dealer gamma, dealer positioning, geopolitical risk, implied vol, iv, negative gamma, OPEX, spotgamma weekly, SPX, vanna, vol crush, volatility

Apr 05 2026

How One Key Level Drove Last Week’s Rally
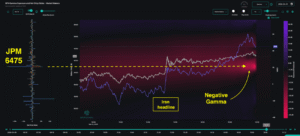
SPX gamma exposure and net OI chart showing price movement with negative gamma spike and Iran headline event on Mar 31, 2026.

The S&P 500 bounced back 2% last week after scraping against 6-month lows. Mixed headlines on the Iran conflict explained much of this tug-of-war, yet markets are still holding their breath. For many traders, the rally felt counterintuitive: How can equities rally so furiously if geopolitical uncertainties remain unresolved? When looking at Tuesday’s major bounce in […]

Written by Simon Scholten · Categorized: Market Analysis, SpotGamma Weekly · Tagged: dealer gamma, dealer positioning, FOMC, geopolitical risk, implied vol, iv, JPM Collar, negative gamma, OPEX, put skew, realized vol, spotgamma weekly, SPX, trace, volatility

Apr 01 2026

GEX & JPM Collar: SpotGamma on TastyTrade
Brent SpotGamma talks with TastyTrade live about JPM Collar Trade, GEX and DEX

How Options Market Structure Controls Intraday Price Action: GEX, Dealer Hedging, and the JP Morgan Collar Trade Most traders watch price. Sophisticated traders watch flow. But the traders with real structural edge watch what dealers are forced to do — because when the biggest participants in the world’s largest options complex are compelled to hedge, markets move […]

Written by SpotGamma · Categorized: Market Analysis · Tagged: DEX, gamma hedging, GEX, hedging, JPM Collar

Mar 29 2026

The New Volatility Regime

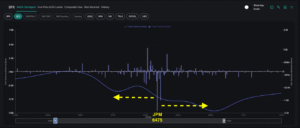
SPX options gamma chart showing total gamma line and bar chart with JPM strike at 6475 marked.

Over the past several weeks, we have consistently highlighted the market’s growing fragility. From the negative gamma “trapdoor” to the destabilizing impact of geopolitical shocks, the message has been clear: this is no longer a range-bound market. Last week confirmed those warnings, as the S&P 500 is down nearly 9% from all-time highs. On Thursday and Friday, traders […]

Written by Simon Scholten · Categorized: Market Analysis, SpotGamma Weekly · Tagged: dealer gamma, dealer positioning, geopolitical risk, implied vol, iv, negative gamma, realized vol, spotgamma weekly, SPX, Synthetic OI, VIX, volatility

Mar 22 2026

After OPEX: Market Loses Its Shock Absorber
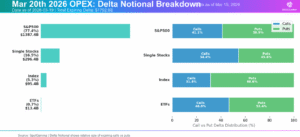
Stacked bar charts showing March 20, 2026 OPEX delta notional breakdown by asset class, with calls vs puts distribution percentages.

The options market has just cleared one of the largest structural events of the quarter, as Friday’s OPEX saw nearly $1.4 trillion in delta notional expire for the S&P 500. Because significant positions have now rolled off from the March expiration, the market has lost an important stabilizing force just as macro pressures begin to build. […]

Written by Simon Scholten · Categorized: Market Analysis, SpotGamma Weekly · Tagged: dealer gamma, dealer positioning, FOMC, geopolitical risk, implied vol, iv, negative gamma, OPEX, put skew, realized vol, spotgamma weekly, SPX, trace, VIX, volatility, Volatility Skew

Mar 22 2026

VIX Expiration, Oil, and the JP Morgan Collar Trade: What’s Driving the S&P 500

Market Summary The market is entering a critical window where VIX expiration, quarterly options expiration, crude oil, and the JP Morgan collar trade are all colliding at once. The core argument is simple: implied volatility remains elevated while realized volatility has stayed unusually muted, and that mismatch may not last much longer. If oil continues […]

Written by SpotGamma · Categorized: Market Analysis · Tagged: Iran, JPM Collar, oil, OPEX, Stock Market Crash, VIX, volatility

Mar 15 2026

March OPEX: Tipping Point or Turning Point?
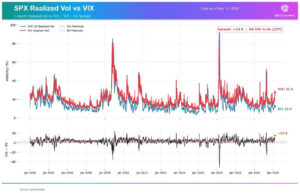
Two charts comparing SPX 1-month realized volatility against VIX implied volatility from 2000-2026, with their spread displayed below.

Fragility, Risk, and Potential Vol Reset As the S&P 500 enters OPEX week, we echo the same theme of the past few weeks: this market remains fragile. Last week’s selloff pushed the index below the three-month trading range of SPX 6,800-7,000 that had held since late 2025, subsequently closing down 5% since mid-January. The conflict with Iran continues […]

Written by Simon Scholten · Categorized: Market Analysis, SpotGamma Weekly · Tagged: dealer gamma, dealer positioning, FOMC, geopolitical risk, implied vol, iv, negative gamma, put skew, realized vol, spotgamma weekly, SPX, trace, VIX, volatility, Volatility Skew

  • « Go to Previous Page
  • Go to page 1
  • Interim pages omitted …
  • Go to page 6
  • Go to page 7
  • Go to page 8
  • Go to page 9
  • Go to page 10
  • Interim pages omitted …
  • Go to page 65
  • Go to Next Page »

Primary Sidebar

SpotGamma-Subscriber-Signup-Banner

  • Index Put Protection Is Cheap With 10-Year Treasury Bonds at 5.3%
  • Friday Jobs Report Preview: What the Market Wants to See
  • Micron Earnings Preview: Can the AI Memory Boom Keep Delivering?
  • Index Put Demand Returns Ahead of Friday’s Jobs Report
  • AI Trade Drives Nasdaq, Small Caps Lag Behind
  • youtube
  • x
  • Privacy Policy
  • Disclaimer
  • Terms & Conditions
  • Support Center
  • Media
  • Contact Us

©2026 TenTen Capital LLC DBA SpotGamma

All SpotGamma materials, information, and presentations are for educational purposes only and should not be considered specific investment advice nor recommendations. Futures, foreign currency and options trading contains substantial risk and is not for every investor. An investor could potentially lose all or more than the initial investment. Risk capital is money that can be lost without jeopardizing one's financial security or lifestyle. Only risk capital should be used for trading and only those with sufficient risk capital should consider trading. Past performance is not necessarily indicative of future results. Testimonials appearing on this website may not be representative of other clients or customers and is not a guarantee of future performance or success.

View Full Risk Disclosure