December is always a large options expiration as we have large open interest and a SPY dividend payment. Because of all of this the expiration has the potential to mark turning points in the market as large positions are closed, roll or expire. 3200 has been a key level the last week with major options […]
Market Analysis
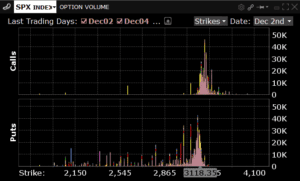
Why Dec ’19’s Large Open Interest Could Cause Volatility
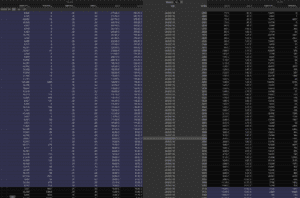
December OPEX has a many strikes that have large open interest (OI). For calls there are many in the money strikes as you can see in the grid below with OI greater than 20k or 40k – the 3000k strike has 125k contracts. There is large size in puts as well, but these are currently […]
SPX Skew Nears All Time Highs
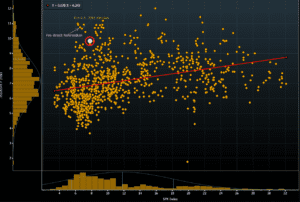
As per Bloomberg, Skew (which measures the price of calls vs puts) can often spike when investors are concerned about market risk. Puts will be in higher demand than calls and this moves the skew measurement higher. Currently skew is very high due to a slew of events in the next week: FOMC, BREXIT vote, […]
Nomuras Pre-Event Gamma View
From heisenberg: Charlie McElligott, Nomura: “As VVIX & Skew went ‘bid’ BIG TIME yday, this indicates that the market is now once again beginning to price-in ‘tail’ scenarios”, “[That] offers attractive risk-reversal opportunities to play for an upside S&P breakout following a potential ‘hedge puke’”, he added, noting that in the event we do get […]
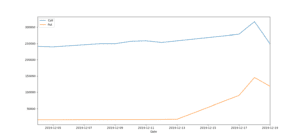
SPX Long Gamma Backtest
Recently an interesting chart was posted on twitter with the backtest of the SPX vs a strategy of owning the SPX only when gamma was positive. This brings up a few interesting points about long gamma and what we think its viable for. Below this chart are some comments and notes regarding the value of […]
December 2019 Market Decline Review
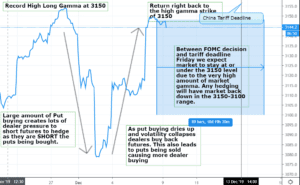
Here is a chart outlining how we saw the selloff during the first week of December 2019. There was record high gamma going into the first week of December which indicates that call:put ratios were at extremes. After a few negative tweets about trade and a poor ISM number selling started, and put buyers stepped […]
SocGen Zero Gamma Chart History
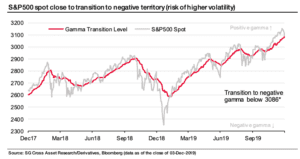
Here is a backtest of where SocGen calculates where positive gamma changes to negative gamma in the S&P500 (SPY). You can view our historical chart here. The concern is that a move through the zero gamma level may set a “gamma trap“. Our FAQ has more information: Zero Gamma Level: This is the estimated level […]
SocGen: November 2019 Largest Positive Gamma Ever
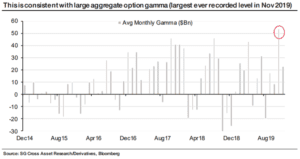
We had recorded extreme readings as well, but our data didnt go back nearly this far.
Nomura’s Gamma December Note
Our model has gamma flipping at 3065, Nomuras is a bit higher. From ZeroHedge The interpretation of Trump’s “better to wait until after the election” for a China trade deal comments is that the Hong Kong human rights bill sponsorship by POTUS has clearly caused agitated the Chinese side (plus this morning’s Reuters report stating […]
Strike of the Deltas – Can Put Deltas Move the Market Down?
Interesting day in the market today as numerous China related headlines took away a futures rally that was testing all time highs. Its our view that much of the selling today was due to put buying. It seems there was a decent amount of slightly OTM puts trading, combined with a large move up in […]
