• Skip to main content
  • Skip to primary sidebar

SpotGamma™

S&P 500 Stock Market Gamma Trading Levels Based on Options Open Interest

  • About
  • Pricing
  • Academy
    • FREE TRADE PLANNING WEBINAR
  • Resources
    • Tool Demos
    • Case Studies
    • Blog
    • Support Center
    • Daily Report
    • Free Trading Tools
      • Opening Setup Free Report
      • Options Profit Calculator
      • SPX Gamma Exposure
      • Implied Earnings Moves
    • Report Card
  • Login

FOMC

Apr 20 2022

The Fed Meeting May Spark The Next Stock Market Rally

Fade The FOMC Minutes

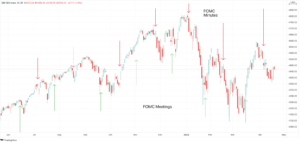
The following is a guest post courtesy of Michael Kramer of Mott Capital Management.  Buy the Fed meeting. Sell the Fed minutes.  It may be the name of the game for the stock market. At least since the start of 2022, the minutes have been a cause of concern for markets, while the FOMC meetings […]

Written by SpotGamma · Categorized: Market Analysis · Tagged: FED, FOMC, hedging, HIRO Indicator, Michael Kramer, vanna

Jan 20 2022

Next Week’s Fed Meeting May Create Massive Moves In The Market
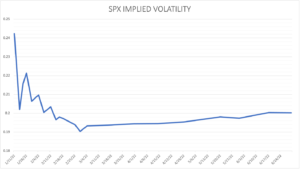
spx high implied volatility jan 2022

The following is a guest post courtesy of Michael Kramer of Mott Capital Management.  Stock market volatility has picked up, and it may only be starting. Investors are eagerly awaiting the next FOMC meeting on January 26 to try and gauge which way the Fed may choose to go in its fight with inflation. With […]

Written by SpotGamma · Categorized: Guest Post, Market Analysis · Tagged: Equity Hub, FOMC, implied volatility, Michael Kramer, SPX

Dec 23 2021

‘Call AAA’: Santa Claus Is Having Sleigh Troubles
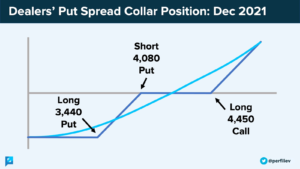
Dealer Put Spread Protective Collar Dec 2021

Through an options market lens, the following text will add color to some recent market movements.

Written by Renato Capelj · Categorized: Market Analysis · Tagged: AMC, ARKK, Call Wall, Cem Karsan, charm, CME, december OPEX, delta, FOMC, gamma, Kai Volatility, liquidity, long gamma, Moody's, Newfound Research, OPEX, put wall, short gamma, SPY, TSLA, vanna, VIX

Sep 27 2021

A Volatility Crush Is Masking An Unhealthy Stock Market
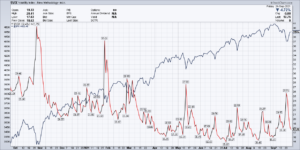
Buy The Dip S&P 500 Rip

The following is a guest post courtesy of Michael Kramer of Mott Capital Management.  The S&P 500 finished the week ending September 24 up a mere 50 basis points, a tranquil week – on the surface.  Volatility was fierce to start the week, a dynamic predicted by SpotGamma and shared with their subscribers last week. […]

Written by developer · Categorized: Guest Post, Market Analysis · Tagged: FOMC, Michael Kramer, VIX, volatility

Sep 09 2021

This Might Not Be a September to Remember: Options Expiration + FOMC Risk
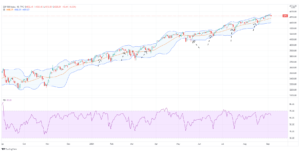
S&P 500 Bollinger Bands September Options Expiration

The following is a guest post courtesy of Michael Kramer of Mott Capital Management.  The September monthly options expiration, which also happens to be a quarterly quadruple witching, occurs just days before the next FOMC meeting. As noted previously, the market appears to be anxious about this upcoming meeting, and it is easy to understand why. The prospects […]

Written by developer · Categorized: Guest Post, Market Analysis · Tagged: FOMC, Michael Kramer, options expiration

Apr 28 2021

SpotGamma’s FOMC Preview April ’20

FOMC-options-levels-spotgamma

Written by SpotGamma · Categorized: Market Analysis · Tagged: Call Wall, FOMC, Implied Move

Jan 28 2020

Virus Outbreak – Week in Review

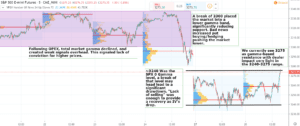
This 5-minute candlestick chart of S&P 500 E-mini futures shows volume profiles and notes on gamma levels at 3240 and 3275.

Ahead of important AAPL (Apple) earnings and the FOMC we wanted to review the market over the past week. We have spent a lot of time drawing an analogy between todays market and that of January ’18 (see here). Interestingly the Jan ’18 market topped the same day as the current market. Currently gamma is […]

Written by tenten · Categorized: Market Analysis · Tagged: AAPL, coronavirus, FOMC, january 2018, zero gamma

Sep 16 2019

Saudi Oil Attack Options Gamma

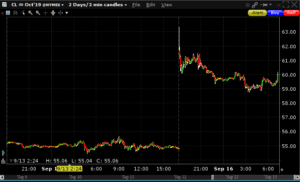
2-minute candlestick chart of CL Oct'19 futures showing a sharp rise from 55 to 63 around September 12.

Here is a quick snapshot after the Saudi Oil attack – options gamma is still quite long with over $1bn long gamma per point in the S&P500. This may have had an effect on muting or “deleveraging” the reaction to the news about the Saudi Oil attack. There was a very large move in crude […]

Written by SpotGamma · Categorized: Market Analysis · Tagged: FOMC, futures, gamma, saudi oil attack

  • « Go to Previous Page
  • Go to page 1
  • Go to page 2
  • Go to page 3

Primary Sidebar

SpotGamma-Subscriber-Signup-Banner

  • Anthropic’s IPO: Could ANT Spark the Next AI Rally After OPEX?
  • Nvidia’s Lukewarm Reaction And The Flows Into Thanksgiving Week
  • Walmart Earnings Preview: Putting the Consumer to the Test
  • NVIDIA Earnings Preview: Can AI Growth Overcome the Leadership Shock?
  • The Market’s Rebound Fuel Runs Low
  • youtube
  • x
  • Privacy Policy
  • Disclaimer
  • Terms & Conditions
  • Support Center
  • Media
  • Contact Us

©2026 TenTen Capital LLC DBA SpotGamma

All SpotGamma materials, information, and presentations are for educational purposes only and should not be considered specific investment advice nor recommendations. Futures, foreign currency and options trading contains substantial risk and is not for every investor. An investor could potentially lose all or more than the initial investment. Risk capital is money that can be lost without jeopardizing one's financial security or lifestyle. Only risk capital should be used for trading and only those with sufficient risk capital should consider trading. Past performance is not necessarily indicative of future results. Testimonials appearing on this website may not be representative of other clients or customers and is not a guarantee of future performance or success.

View Full Risk Disclosure