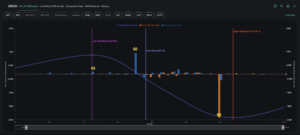
The S&P 500 delivered a high octane four-day run last week, establishing all-time highs with a 6% rise from weekly lows. Shifting interest rate expectations, easing Middle East tensions, and strong corporate earnings powered the dramatic rally. The sharp surge brought out notable divergences across the tech space. Software outperformed the broader market, with strong […]
options positioning
The New Normal in Volatility Takes Shape
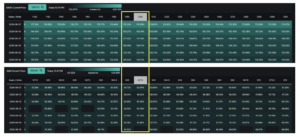
The final week of July proved to be quite dramatic. An FOMC decision, PCE inflation data, and the Super Bowl of Q2 earnings all took place over the span of just 2 days, with companies representing 36% of the S&P 500 by weight reporting results last week. The results were extreme: U.S. 30-year treasury yields […]
Big Tech Earnings and FOMC Collide
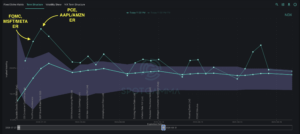
The Dispersion Unwind Arrives Last week, we noted in our pre-market Founder’s Note that markets were skating on thin ice. In addition to growing macro risks, COR1M had collapsed below 8 signaling extreme dispersion between index and single-stock volatility. After our Risk Pivot level was breached on Thursday, the growing negative gamma environment amplified the […]
Space Stocks: Oversold Bounce or Ready for Liftoff?
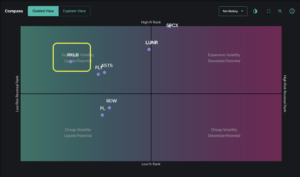
Last month, space stocks rocketed their way onto every trader’s radar. SpaceX’s record-breaking June IPO (SPCX) drew a wave of retail and institutional attention to the sector, while a string of NASA announcements made headline news and fueled several meaningful moves. Overall, the space sector has been defined by a notable downtrend in the past […]
Will the AI Unwind Finally Spill Over?
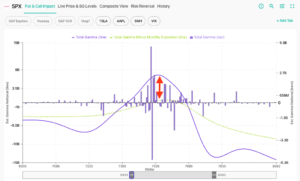
Last week delivered a string of constructive catalysts that supported the market through Thursday. Inflation ran cooler than expected, bank earnings impressed, retail sales beat, and ASML and TSM offered encouraging commentary towards semiconductor demand. While hostilities with Iran escalated, the market remained quite stable until Friday’s 1% drop following the Kimi-3 announcement. The stability […]
Volatility Approaches Record Lows — Is It Priced Too Cheap?
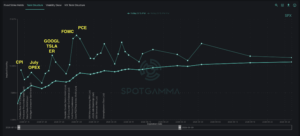
The S&P 500 spent early July grinding higher with sector rotation quietly forming beneath a calm index. As SPX price action remained relatively muted over the past week, implied volatility dropped to near-record lows as of Friday: IV for contracts expiring next week now sit in the 6-10% range. Regardless of any directional bias for […]
Passing the Baton: From Semis to Software?
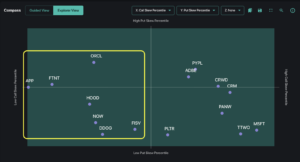
The AI trade has been the story of the first half of 2026, and semiconductors have been the main characters. The sector now accounts for roughly 20% of the entire S&P 500 — a historically high concentration. As we covered in our previous newsletter, any meaningful profit-taking in this area brings up the important question […]
July’s Setup: Rotation and Repositioning
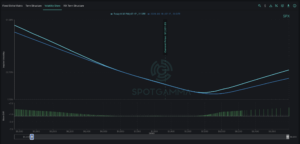
June lived up to its reputation as a volatile month with last week’s market drawdown. As we turn the page into July, the market now appears to be recalibrating positioning. Recent turbulence has driven capital rotation out of crowded tech leadership, and we now look for opportunities in alternative pockets of the market. In our […]