• Skip to main content
  • Skip to primary sidebar

SpotGamma™

S&P 500 Stock Market Gamma Trading Levels Based on Options Open Interest

  • About
  • Pricing
  • Academy
    • FREE TRADE PLANNING WEBINAR
  • Resources
    • Tool Demos
    • Case Studies
    • Blog
    • Support Center
    • Daily Report
    • Free Trading Tools
      • Opening Setup Free Report
      • Options Profit Calculator
      • SPX Gamma Exposure
      • Implied Earnings Moves
    • Report Card
  • Login

implied volatility

Oct 01 2026

Friday Jobs Report Preview: What the Market Wants to See

Friday Jobs Report Preview: What the Market Wants to See

The stock market faces its biggest economic test of the week Friday morning when the September jobs report is released at 8:30 a.m. ET.

Written by SpotGamma · Categorized: Market Analysis · Tagged: gamma, implied volatility, jobs report, negative gamma, payrolls, SPX, TLT, volatility

Sep 29 2026

Micron Earnings Preview: Can the AI Memory Boom Keep Delivering?
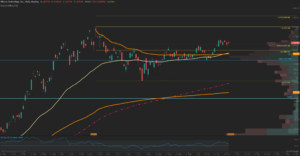
Micron (MU) daily candlestick chart from April to late September 2026 with moving averages, Fibonacci retracement levels, volume profile and RSI, showing the stock near $1,070 just above the 0.618 retracement at $1,057.

Micron (MU) reports earnings Wednesday after the close, and this may be one of the most important semiconductor reports of the week.

Written by SpotGamma · Categorized: Market Analysis · Tagged: butterfly spread, call spread, earnings, gamma, implied volatility, iron condor, MU, negative gamma, put spread, volatility

Sep 27 2026

META Rewrites the AI Trade

Meta’s new Muse AI Agent has done what a year of capex headlines could not: it has convinced the market that the company’s $200 billion investment in AI has a consumer-facing payoff. META rallied 13% over the past week and pushed toward 52-week highs as the personal agent app topped the download charts. The enthusiasm […]

Written by Sherry An · Categorized: Market Analysis, SpotGamma Weekly · Tagged: dealer gamma, Gamma Exposure, implied volatility, META call spread, META implied volatility, Meta Muse AI agent, META options, Options Calculator, options positioning, options skew, spotgamma weekly

Sep 24 2026

Erasca’s November Catalyst: Promising Data, High Expectations and Strategic Optionality
Erasca’s November Catalyst: Promising Data, High Expectations and Strategic Optionality

The company’s lead drug, ERAS-0015, has shown encouraging early results. On November 20, Erasca will provide updated clinical data that could produce a large move in the stock.

Written by SpotGamma · Categorized: Market Analysis · Tagged: binary, biotech, call spread, ERAS, implied volatility, skew, term structure

Sep 22 2026

Costco Earnings: What Shoppers—and Options—Are Telling Us
Costco reports Thursday, September 24, after the close, giving investors a timely consumer check during a quieter earnings week. The key question: Are shoppers spending confidently, or turning to Costco to stretch tighter budgets? Costco can benefit under either scenario. But the answer matters for the rest of retail: gaining customers who are hunting for […]

Written by SpotGamma · Categorized: Market Analysis · Tagged: COST, credit spread, earnings, gamma, implied volatility, IV Rank, open interest

Sep 20 2026

Quiet Oil Options Mask Tail Risk

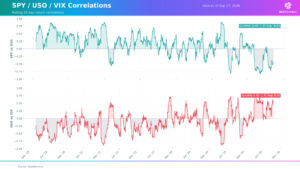
Dual line charts of rolling 20-day return correlations for SPY vs USO and USO vs VIX from 2019 to 2026.

Oil prices drove headlines this past week amidst flare-ups in the ongoing Iran conflict. WTI crude broke above $100 on September 15, and diesel fuel hit an all-time high of $6.31 per gallon. The mystery is that despite the price spike, the options market for oil remains unusually subdued. The CBOE Crude Oil Volatility Index […]

Written by Sherry An · Categorized: Market Analysis, SpotGamma Weekly · Tagged: COP options, CVX options, dealer gamma, Gamma Exposure, implied volatility, oil options, oil refiners, oil shorts, Options Calculator, options positioning, options skew, OVX, spotgamma weekly, USO puts, XOM options

Sep 18 2026

Celsius Insiders Are Buying the Dip — And Options Are Cheap Into the Catalyst
Celsius Insiders Are Buying the Dip — And Options Are Cheap Into the Catalyst

Three CELH insiders bought roughly $1.8 million of stock on the open market within six days in mid-September, one of them paying above the close. A look at why they bought when they did, and why the options market has not repriced for any of it into the November 5 print.

Written by SpotGamma · Categorized: Market Analysis · Tagged: CELH, implied volatility, insider buying, IV Rank, negative gamma, open interest, skew, volatility

Sep 17 2026

Trump Xi Summit and the Market Outlook
Trump–Xi Summit: What Markets Are Watching on September 24

President Trump hosts Xi Jinping on September 24, days after the Fed’s first rate hike since 2023. Tariffs, rare earths, chip policy and Taiwan are all in play — and SpotGamma’s Compass shows cheap implied volatility across several China-sensitive names.

Written by SpotGamma · Categorized: Market Analysis · Tagged: china, gamma, implied volatility, retail stocks, risk reversal, tariffs, volatility

Sep 15 2026

FOMC Preview: The Hike Is Priced. The Dots Aren’t.
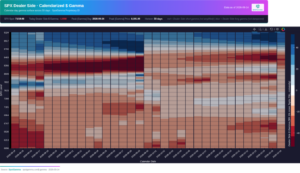
FOMC Preview: The Hike Is Priced. The Dots Aren't.

A 25bp hike is overwhelmingly expected on September 16, which makes the dot plot the real surprise vector. A look at what the options market is pricing, where the big volatility hedges are showing up, why September VIX settles before the decision, and why Friday’s expiration may be the bigger structural event.

Written by SpotGamma · Categorized: Market Analysis · Tagged: bonds, FOMC, gamma, implied volatility, interest rates, OPEX, SPX, VIX, volatility

Sep 15 2026

Gamma Guy: S&P 500 Realized Volatility Is the Lowest Since 2020

Gamma Guy: S&P 500 Realized Volatility Is the Lowest Since 2020

Brent Kochuba, founder of SpotGamma, joined tastylive Tuesday to explain why S&P 500 realized volatility sits at 2020 lows ahead of FOMC and a huge OPEX.

Written by SpotGamma · Categorized: Market Analysis · Tagged: 0DTE, FOMC, implied volatility, NDX, negative gamma, OPEX, realized volatility, SPX, tastylive, VIX

  • « Go to Previous Page
  • Go to page 1
  • Go to page 2
  • Go to page 3
  • Go to page 4
  • Go to page 5
  • Go to page 6
  • Interim pages omitted …
  • Go to page 8
  • Go to Next Page »

Primary Sidebar

SpotGamma-Subscriber-Signup-Banner

  • The Market’s Rebound Fuel Runs Low
  • The OPEX Effect: A Put-Heavy Expiration And The Thanksgiving Window
  • Applied Materials Earnings Preview: Can AI Demand Deliver a Move Beyond the 7% Options Hurdle?
  • Options Action: Nvidia Vol Looks Rich While Apple’s Stays Muted
  • CoreWeave Earnings Preview: Can AI Demand Outrun the Cost of Growth?
  • youtube
  • x
  • Privacy Policy
  • Disclaimer
  • Terms & Conditions
  • Support Center
  • Media
  • Contact Us

©2026 TenTen Capital LLC DBA SpotGamma

All SpotGamma materials, information, and presentations are for educational purposes only and should not be considered specific investment advice nor recommendations. Futures, foreign currency and options trading contains substantial risk and is not for every investor. An investor could potentially lose all or more than the initial investment. Risk capital is money that can be lost without jeopardizing one's financial security or lifestyle. Only risk capital should be used for trading and only those with sufficient risk capital should consider trading. Past performance is not necessarily indicative of future results. Testimonials appearing on this website may not be representative of other clients or customers and is not a guarantee of future performance or success.

View Full Risk Disclosure