• Skip to main content
  • Skip to primary sidebar

SpotGamma™

S&P 500 Stock Market Gamma Trading Levels Based on Options Open Interest

  • About
  • Pricing
  • Academy
  • Resources
    • Tool Demos
    • Case Studies
    • Blog
    • Support Center
    • Daily Report
    • Free Trading Tools
      • Opening Setup Free Report
      • Options Profit Calculator
      • SPX Gamma Exposure
      • Implied Earnings Moves
    • Free Training
    • Report Card
  • Login

market makers

May 17 2026

NVDA earnings vs. a stretched S&P 500

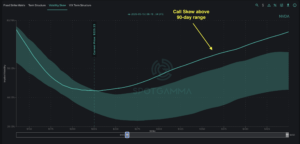
Volatility skew chart for NVDA showing call skew above the 90-day range with implied volatility on the y-axis and strike price on the x-axis.

For the fourth consecutive week, the S&P 500 has struck records highs. This week’s breach of SPX 7,500 even arrived in the face of hotter-than-expected CPI and PPI prints — data that historically would have triggered a meaningful selloff. The tone shifted somewhat on Friday, as the rally lost steam into monthly OPEX. The week […]

Written by Sherry An · Categorized: Market Analysis, SpotGamma Weekly · Tagged: call options, dealer gamma, dealer hedging, Gamma Exposure, implied vol, market makers, May OPEX 2026, NVDA earnings, NVDA implied move, options market analysis, options volatility skew, semiconductor stocks, spotgamma weekly, SPY put butterfly, tail hedge options

May 10 2026

The AI Trade Roars — But for How Long?
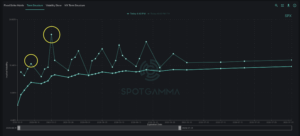
SPX term structure chart showing implied volatility curves from May to July 2026 with two circled peaks.

Last week, strong earnings pushed both the S&P 500 and Nasdaq to — once again — achieve all-time highs. Through the fast and furious AI-driven rally of the past 6 weeks, SPX has climbed 15% while NDX has surged 28%. The market’s pace of advance is well beyond historical norms, reflecting an exceptionally aggressive repositioning […]

Written by Sherry An · Categorized: Market Analysis, SpotGamma Weekly · Tagged: 0DTE options, call options, dealer gamma, dealer hedging, earnings, Gamma Exposure, implied vol, market makers, May OPEX 2026, options market analysis, semiconductor stocks, spotgamma weekly, SPX options, VIX expiration, volatility

May 15 2025

Put-Covering Rallies & Signals in Our SPY Gamma Exposure (GEX)
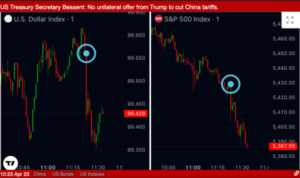
Two candlestick charts of U.S. Dollar Index at 99.429 and S&P 500 Index at 5,387 with Bessent China tariffs headline.

The big question: Was that rally all put covering? Signals in SpotGamma’s custom SPY GEX say “Yes” This week the S&P500 rallied ~3% to close the Liberation Day downside price gap (red horizontal line). This led the S&P500 to notch a 9-day win streak – the longest such streak since November 2004. With that, the VIX […]

Written by SpotGamma · Categorized: Market Analysis · Tagged: market analysis, market makers, options flows, put calls, put rallies, SPX

Mar 18 2020

RealVision: Excellent Gamma Discussion

Market Makers & Coronavirus: The Mechanics of a Market Sell-Off How do sell-offs actually happen? With the S&P 500 selling off hard and fast, Hari Krishnan, fund manager at Doherty Advisors, breaks down the mechanics of market meltdowns. Krishnan explains the role of different institutional players like market-makers and drills down on the individual components […]

Written by tenten · Categorized: Market Analysis · Tagged: coronavirus, gamma, hari krishnan, market makers, realvision

Dec 19 2019

BusinessInsider.com Talks Gamma

A good primer on market gamma from BI: So why do markets move at all if gamma is, like in this example, the big decelerator? Because it depends who owns it. Market makers use their gamma because they must. There is nothing worse than sitting on a position and bleeding white over time as your […]

Written by SpotGamma · Categorized: Market Analysis · Tagged: business insider, gamma, gamma flip, market makers

Dec 02 2019

Strike of the Deltas – Can Put Deltas Move the Market Down?
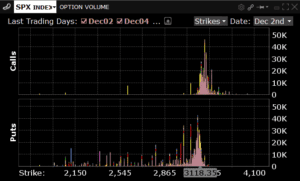
Bar charts of SPX INDEX option volume for calls and puts by strike from 2,150 to 4,100, highlighted at 3,118.

Interesting day in the market today as numerous China related headlines took away a futures rally that was testing all time highs. Its our view that much of the selling today was due to put buying. It seems there was a decent amount of slightly OTM puts trading, combined with a large move up in […]

Written by SpotGamma · Categorized: Market Analysis · Tagged: hedging, market makers, options volume, put delta, VIX

Aug 19 2019

Gamma Market From 8/16/19

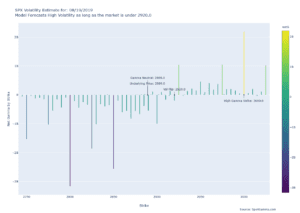
Bar chart of SPX net gamma by strike on 08/19/2019 labeled gamma neutral 2889, vol flip 2920, high gamma strike 3000.

Volatility will continue to reign until (if) the market recaptures 2920. There is a ton of fuel ready to burn and one headline (or tweet) will send the market flying. The only recommendation that is safe here is to not sell any options, being short volatility is very dangerous here, as a >3% rally is […]

Written by tenten · Categorized: Market Analysis · Tagged: futures, market gamma, market makers, open interest, options gamma, S&P500, SPX, SPY

Aug 16 2019

Dealers Running Out of Gas 8/16/19

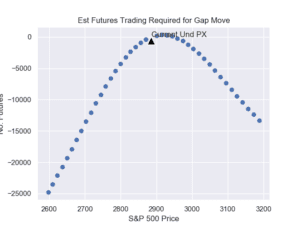
Scatter plot of estimated futures vs S&P 500 price from 2600-3200, peaking near 0 around 2900 with current und PX marked.

After a sharp rally this morning the S&P500 stands at ~2890. This is where dealers buying starts to soften up. You can see their volume profile in the chart below. They were strong buyers up to this level but we calculated 2891 as the level where their buying wanes and 2920 where they flip to […]

Written by tenten · Categorized: Market Analysis · Tagged: futures, gamma, market makers, options, SPX, SPY

Aug 14 2019

Dealer Futures Flow 8/14/19

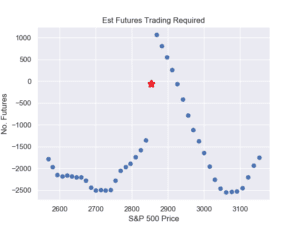
Scatter plot titled Est Futures Trading Required of No. Futures vs S&P 500 Price with a red star near 2850.

Here is a chart estimating the futures action with the S&P500 at 2850. If markets head lower it looks like dealers will sell more futures, compounding the move down. The same works in a rally, but instead of selling those dealers will be buying. All this flips when/if the market moves over the VFLIP line […]

Written by tenten · Categorized: Market Analysis · Tagged: futures, gamma, market makers, options, S&P500, SPX

Jul 31 2019

Fed Day Market Move from a Gamma Perspective
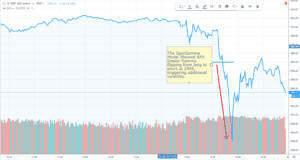
S&P 500 line chart with volume, a yellow note on gamma flipping short at 2995, and a red arrow marking a drop.

Equity markets had an incredibly volatile day on 7/31/19 triggered by actions of the Federal Reserve. Its our view that the moves were exacerbated by the positioning of dealers in S&P 500 options. A quick wave of selling entered the markets just above 3000, pushing the market under our “volatility trigger” level of 2995. At […]

Written by tenten · Categorized: Market Analysis · Tagged: fed day, market makers, market selloff, options gamma

  • « Go to Previous Page
  • Go to page 1
  • Go to page 2

Primary Sidebar

SpotGamma-Subscriber-Signup-Banner

  • Ratio Spreads: Buying One, Selling Two
  • Call Backspread: Positioned for the Melt-Up
  • Box Spreads: The Options Market’s Bond
  • Risk Reversal: Trading Direction With Skew
  • Synthetic Long Stock: Options That Mirror Shares
  • youtube
  • x
  • Privacy Policy
  • Disclaimer
  • Terms & Conditions
  • Support Center
  • Media
  • Contact Us

©2026 TenTen Capital LLC DBA SpotGamma

All SpotGamma materials, information, and presentations are for educational purposes only and should not be considered specific investment advice nor recommendations. Futures, foreign currency and options trading contains substantial risk and is not for every investor. An investor could potentially lose all or more than the initial investment. Risk capital is money that can be lost without jeopardizing one's financial security or lifestyle. Only risk capital should be used for trading and only those with sufficient risk capital should consider trading. Past performance is not necessarily indicative of future results. Testimonials appearing on this website may not be representative of other clients or customers and is not a guarantee of future performance or success.

View Full Risk Disclosure